Showing posts with label Trading Philosophy. Show all posts

Monday, March 26, 2018

Don't look stupid!!

0
I did have a motto for today's trades: "Don't look stupid." I didn't want to look stupid like on Friday.
(Note: I that said "Don't look stupid.", not "Don't be stupid." There's a difference between the two.)

  • I can look stupid when I miss a good move even after watching the chart the whole while.
  • I can look stupid when I exit early from a big move.
  • I can look stupid when I watch a profit turn into a loss.
  • I can look stupid when I book a series of losses.
  • I can look stupid when I attempt trades on a grinding day.
  • I can look stupid when I broadcast my losses to the world. 
  • I can look stupid just for day trading. (This I intend to do)

  • I can look smart when I capture a big move.
  • I can look smart when I capture a small move that then did not go on to become a big move.
  • I can look smart when I scratch an entry that does not go anywhere.
  • I can look smart by broadcasting more about successes and hiding most of my losses. (I don't do this, and hopefully my twitter feed vouches for it.)
  • I can look smart by spouting predictions, analysis and philosophy like the TV analysts. 
  • I can look smart when I do some positive psyching of myself or others.

I can look stupid when I make a loss.
I can look smart when I make a big profit.

But I am only really smart when I learn the right lessons. I am only really smart when I have a net profitable trading system. I am only really smart when I apply the right money management to profit from a net profitable trading system. I am only really smart when I realize that all that positive psyching is only going to work if I implement a net profitable trading system and money management. (What's the point of this blog?)

Today's trading

The first trade was not very high on the stupidity scale, because it reversed almost immediately and did not give much of a chance to trail. However, it would still look stupid to enter in the middle of previous day's range after a dull opening.

I would have looked really smart had I captured the reversal at the low of the day, but I have the excuse that I was out on some errand at that time.

The second trade would have looked stupid if the Initial Stop Loss had been hit, after entry at the Day's High. The exit would have looked bad if I had not reentered in the same direction.

The third trade was kind of ok, in hindsight, though it was taken just 10 minutes before auto sqaure-off.


Nifty M3 Price Action Chart


Read Full Post »

Sunday, September 10, 2017

% The Evil Percentage %

0
Language shapes our perceptions. It is almost impossible to express and develop ideas that are not expressible in language. To progress beyond limitations of current thinking, it would be necessary to move beyond current notations. Mathematical notations are one example of the how ideas can be developed further beyond the confines of current language.

There are also self-inflicted constraints that we impose on ourselves to restrict our thinking. Our value systems, our education, traditions, our sources of information bias us to think in a certain way.....

The evil percentage
The evil percentage   source:custom-it.fr


For years, I have been using Win % to evaluate the performance of trading systems. That is perhaps the most common way to indicate the Win-Loss Ratio. However, it is also terribly misleading to indicate Win-Loss Ratio with a Win % - at least to me. Nowadays, I always translate the % into a ratio, and that helps me a lot.

Here are a couple of posts that I had earlier posted in the Bakwaas Trading thread of the Traderji forum.


The importance of the win rate


I am treating this thread more like a scratchpad... So, I am putting out another of my half-baked thoughts here.

For the purpose of this post, I am ignoring Risk-Reward Ratio, which everyone knows is a very important factor in determining a trader's happiness.

Let's say that there are 2 systems - the first has a win rate of 49% and the second has a win rate of 51%. A 2% difference in win rate is not much.

But if you think about it, the first system will win 0.961 times for every loss. The second system will win 1.041 times for every loss. The values calculated as win%/loss% = win%/(100%-win%). So, the second system has a (1.041/0.961) = 1.083 better chance of producing a winner than the first system.....

Restating, a system with a 51% win rate is 8.3% better at producing winners that a system with a 49% win rate. Just a 2% difference in win rate gives me a 8.3% better chance at happiness :)

Take a system with a 45% win rate, and another with 50% win rate. The 50% win rate gives me a 22.2% better chance at happiness than the 45% win rate.

Similarly....

50% win rate --> gives 50% more happiness than --> 40% win rate
60% win rate --> gives 50% more happiness than --> 50% win rate
60% win rate --> gives 125% more happiness than --> 40% win rate
50% win rate --> gives 133.3% more happiness than --> 30% win rate
50% win rate --> gives 200% more happiness than --> 25% win rate
50% win rate --> gives 300% more happiness than --> 20% win rate
10% win rate --> gives 111.1% more happiness than --> 5% win rate
99% win rate --> gives 102% more happiness than --> 98% win rate

and finally,

100% win rate --> gives infinite times more happiness than --> 99% win rate

See... we have scientifically proven that trader's nirvana can be achieved by 100% win rate.

With a higher win rate, the chances of prolonged drawdowns reduces, and so does your blood pressure. With a 100% win rate, you could practically be dead.

Perception


Continuing my blabber from my previous post.... a casual look at win rate of 49% or 51% does not indicate that the impact between the 2 win rates could be more than 2%, like it actually is. Instead, would it have been better to state that the wins-to-loss ratio are 0.961 and 1.041 respectively?

Nowadays, for my trading systems - whether live or backtesting, I use the terms "plus" and "minus", instead of "win" and "loss". Even, when I use the terms "win' and "loss", like in the previous posts, internally I am translating them to mean "plus" and "minus". A "minus" does not give me the same feeling as a loss. It's not a defeat, it is just something that is expected in this business of trading, well anticipated after backtests and simulation. Similarly, a "plus" is not a win, a triumph. Unlike a "win", a "plus" is not going to give me a heady rush of adrenaline that wrecks my psychology. "plus/minus" keeps me calmer emotionally than "win/loss".

I am not very satisfied with the terms "plus" and "minus", but for now they will do - until I am able to expand my vocabulary, or ideate better. In George Orwell's book "1984", Big Brother's party invents Newspeak - a version of English with reduced vocabulary, concepts and rigid structure - just to prevent people from thinking anti-party thoughts. If you don't have the vocabulary to think thoughts, how will you think, communicate and take ideas forward?

So, here, I am trying my own Newspeak, just to get my thoughts and ideas in the right direction (though I am never sure about the direction being right). For now, I can think of viewing "win" rates differently, and "plus/minus"...

Read Full Post »

Perpetual Dilemmas

0
Since my last post, I have been system hopping again. I have evolved the discretionary range compression trading system into a mechanical trading system. That is one reason that I stopped posting. The other reason is that I have started trading Crude Oil after many years, so my free time has reduced by that much.

By now, the trading system is almost the opposite of the narrow range consolidation system that it evolved from. Now, I am looking for a sustained move in one direction that could potentially build into a bigger move in the same direction. The Stop Loss is wider, but not too wide. The system hopes to catch at least 95% (or 19 out of 20 times) of the big moves early on - but whether it will be able to remain in position to catch the bulk of the move is open to question. And it is still evolving, even during runtime.

So, the perpetual dilemmas continue.... discretionary vs. mechanical trading systems, wide stop losses vs. narrow stop losses, fixed stop losses vs. trailing stop losses, limit entries vs. trigger based entries, price action vs. statistical trading, scalping vs. swing trading... the list of alternatives goes on.

Sometime what works doesn't work at other times, on other scrips or on the same scrip.... as in Friday's trades below. System that worked for me for months, just stop working after some time. This has happened to me multiple times with the Opening Range Breakout system. Even the Range Compression trading system worked very well for sometime. The Princess Trading system that I traded for 11 months- that is longest that I have traded a single trading system - did not work during the first half of 2017, though it has started to perform again recently.

Friday's trades:

Nifty was clogged in a range. Not a good day with my current mechanical trading rules....

NIFTY M3 Price Action Chart


Crude Oil has been a revelation. The plan is to catch the momentum moves. I have decided to watch Crude Oil only after 5 PM, because it is usually boring and misleading until then - but sometimes moves to start right at the day beginning like on September 5th.

The plan was also to close the chart at 8 PM, unless I had an open trade, but Friday's move will make me keep the charts open longer, I guess.

CRUDEOIL M3 Price Action Chart


Read Full Post »

Thursday, November 3, 2016

Kissing the frog - Trading System evaluation

0

The Prince of the Markets


Once upon a time, not so long ago, there was a Prince (in reality, a pauper) called Augubhai, who was attracted to every Trading System that caught his eye - as though the Trading System were a Princess. He would embrace the Princess whole-heartedly, close his eyes and kiss her - only to realize that the Princess was a frog, when he opened his eyes.

Disappointed, but not disheartened, he would muster vim, and with renewed vigor, he would resume his search for his ideal Princess. And then he would embrace her whole-heartedly, close his eyes and kiss her - only to realize that it was a frog - like always.

The Prince was smart fellow (in reality, a stupid fellow - but this is a fairy tale). One day, while thinking with the core logical part of his left brain - just as logically as Archimedes did long, long ago - he had an eureka moment. He realized that every time he kissed a Princess, it turned out to be a frog. So, logically, if he kissed a frog, it should turn into a Princess. It was so logical a postulate, that he was surprised that it took such a long time for a smart fellow (in reality, stupid) like him to discover it.


The reality of the Markets


But the Prince finally realized that his postulate was not working. As they say, the reality of the markets is different from the reality of logic and reason and Archimedes. As they also say, it is yucky, and not easy to kiss frogs. Kissing frogs did not turn them into Princesses - at least, not too often. Kissing frogs needs you to discard irrational exuberance that this one will be a Princess. But you also need that little hope - a low probability hope - that there would be a Princess somewhere out there. This hope is not like a exuberance of a lottery buyer, because kissing frogs is much harder than buying the lottery.

The Prince stopped trading every random Trading Systems that seemed visually, logically and/or emotionally pleasing. Trading Systems that appeared to be visually, logically and/or emotionally pleasing seemed to be Princesses, but in reality, most were frogs. The records of the Prince trying out random Trading Systems, day after day, month after month, year after year can be found in the Princess Diaries in the Traderji forum:


Persistence and Perseverance


Now the Prince takes a hard look at Trading Systems before trading them, backtesting and scenario testing them, before actually trading them with money. After all, these Trading Systems are mostly frogs, and frogs rarely turn into Princesses. The spirit of what the Prince does now is similar to what he describes in these pages at Traderji: http://www.traderji.com/trading-diary/90116-dasara-system-49.html#post918162.

The Prince has even frog-zoned the Opening Range Breakout system, at least for now. Even the Range Compression Trading System that he traded earlier this year is out of his embrace. These systems were really beautiful, enticing.... closer to being Princeses than frogs. But Princesses need more refinement and polish, and maybe with some refinement these Trading Systems may turn out to be real Princesses.


Hope... hopefully, not irrational


Fairy tales do not have sad endings... and neither does this one. The Prince actually did kiss a frog that turned out to be a Princess. That is the Trading System that the Prince trades currently. With the application of the Kelly Criterion, the Prince thinks that he will soon amass wealth and riches far beyond his imagination. But the due to past experiences, the Prince has the nagging fear that this Princess would also turn into a frog one day. To mitigate the fear, the Prince continues to evaluate other Trading Systems, continues to kiss frogs in the hope of finding more Princesses to enhance his harem.

One probable reason why the Prince went on the Princess kissing spree earlier, was because he did not have a Princess, and was desperate to find one by any means. Now that he already has a Princess, he is now more choosy and strategic about kissing frogs.... well, at least this is what his psychologist thinks.

Fairy tales have morals. What do you think is the moral of this story?


Read Full Post »

Friday, October 21, 2016

Kelly Criterion - Position Sizing to Maximize Returns

3
Recently (since August 30th), I have started using the Kelly Criterion to decide the position size of my day trades. I have known about the Kelly Criterion for a long time, but have only had the confidence to use it now.

Why now? 'Cause, I have spent hours on backtests, and finally seem to have arrived at a trading system that gives consistent results over a few years, and gives me enough confidence to decide the p and b needed to calculate the position size according to the Kelly Criterion.

How confident? We will come to that later...


Kelly Criterion (Wikipedia link)


f = ( p * ( b + 1 ) -1 ) / b


where,
f = optimal fraction of capital to be risked to maximize long term gain
p = probability of winning (Win %)
b = expected reward per unit of risk (Risk to Reward Ratio)

As long as you know your p and b, risk f.


Kelly criterion - Why NOT?


Open any article about Kelly Criterion - not excluding the Wikipedia article - and you will find many reasons/arguments given to avoid Kelly Criterion. These include everything from the fact that you cannot predict the future, to the gambler's/trader's tendency to overestimate system performance, to reducing volatility of returns, to expected utility, to etc. etc. etc....

Also, to not incite novices and gamblers to risk ruin. (My risk disclaimer is at the bottom of this page)

From what I understand, I think that the Kelly Criterion was originally designed to determine the optimal bet sizes in scenarios where you know/assume the odds and probabilities. How do you apply it to markets that are dynamic? How do you determine the odds and probabilities? (The odds part may not be an issue for systems that have predetermined entries, stops, and targets)


Kelly criterion - Why not?!! 


Below, is an example that I had earlier posted in the Bakwaas Trading thread of the Traderji forum...


For example, if a system has a Win % of 50% and Risk to Reward Ratio of 1.6, then the optimal risk according to the Kelly Criterion is 18.75% of compounded capital on every trade.

- If we risk 19% per trade, then after 100 trades, the capital will be 15.42 times the initial capital (1442% return on capital)
- If we risk 18% per trade, then after 100 trades, the capital will be 15.36 times the initial capital
- If we risk 15% per trade, then after 100 trades, the capital will be 13.87 times the initial capital
- If we risk 10% per trade, then after 100 trades, the capital will be 8.61 times the initial capital
- If we risk 5% per trade, then after 100 trades, the capital will be 3.61 times the initial capital
- If we risk 2% per trade, then after 100 trades, the capital will be 1.76 times the initial capital (76% return on capital - not too bad)
- If we risk 1% per trade, then after 100 trades, the capital will be 1.34 times the initial capital (34% return on capital)

Oh, I forgot to mention what happens when we increase the risk beyond the optimal %.

For the same parameters as above,

- If we risk 20% per trade, then after 100 trades, the expectancy is that capital would be 15.25 times the initial capital
- If we risk 25% per trade, then after 100 trades, the expectancy is that capital would be 11.47 times the initial capital
- If we risk 30% per trade, then after 100 trades, the expectancy is that capital would be 5.86 times the initial capital
- If we risk 40% per trade, then after 100 trades, the expectancy is that capital would be 0.45 times the initial capital (55% loss of capital)
- If we risk 50% per trade, then after 100 trades, the expectancy is that capital would be 0.01 times the initial capital (99% loss of capital)
- Risk above 50%, then after 100 trades or lesser, and have the expectancy of losing 100% of your capital!!

 Would I not choose a 1442% return over 76% return? Why not?!!


Anti-Kelly reasons (excuses?) 


The problem is that we are unsure of the future win % and RR ratio of trading systems. I guess that is the reason most books recommend 1-2% risk.

The return with 19% risk looks grand... but there could be practical difficulties.

1. Will the Win % and RR ratio of the system hold into the future?
2. What happens when the system hits a continuous losing streak? According to calculations, we should still continue to risk the optimal risk %, if the system will get back to the Win % and RR ratio in future.
3. Margin requirements may limit position size, and not allow optimal risk.
4. The market/s may not have sufficient liquidity to allow compounding of position size.
5. With increased position size, slippages and fills may be affected. This will also impact the Win %, RR ratio, and % of Capital risked.

Points 4 and 5 only become relevant when the position size increases significantly. For a small trader, only question 1 to 3 are relevant, and the answer is that we should try to risk close to the optimal risk to get better return on capital. Notice that even if the system performance deviates slightly, the optimal fraction will only vary slightly.


p and b - The indispensable criterion to apply the Kelly Criterion


Read the formula again.

It says that for a given p and b, risk f
Risk f, only if you know p and b
If you do not know p and b, you cannot find f.

f = ( p * ( b + 1 ) -1 ) / b


where,
f = optimal fraction of capital to be risked to maximize long term gain
p = probability of winning (Win %)
b = expected reward per unit of risk (Risk to Reward Ratio)


Read Full Post »

Sunday, June 12, 2016

The Surprise Side - from the Phantom of the Pits

0
Here's an excerpt from the PHANTOM OF THE PITS. I know that this is something that I should know about trading, but I never thought about it this way. It's (instinctive) common sense to look both ways before crossing the road, regardless of what the rules say.


The Surprise Side


POP: When the walk light comes on, assume there is traffic that will run the red light at each intersection you cross. What do you do now before you cross the intersection?

ALS: I would double-check and look both ways before crossing.

POP: Of course, that is the correct answer -- you know what I am after. Now, just because you looked both ways before you crossed and each time you cross you looked both ways and each time there wasn't any traffic that ran the stop light, is there any reason to stop looking each time you cross the intersection? Your answer, of course, is no, you won't stop looking.

What kind of limits did I just give you? Are they life-saving limits before you cross the intersection? Yes, they certainly might be, but you will never know that if you follow the restriction each time you cross the intersection. You can't know if it saved your life for you prevented finding out by looking each time.

But what if you don't look and you lost your life. You certainly won't know you should have looked either.

Does the restriction tell you that, if you look, there will never be any traffic running the stop light? No. Does your experience of crossing and looking tell you what the probability of someone running the light will be? You can make an assumption based on your knowledge at this point. What does an assumption do? It actually presents criteria based on proven facts that are a possibility. It in no way gives you a high probability or low probability but the best answer you can present.

I don't want to lose you in this thinking but to point out that it's the same in trading as in crossing an intersection. We need to make our best assumption of what is possible. We must plan for that assumption in trading as long as it is a possibility and not just when it is probable. This is a very important point in understanding Rule Number 1 correctly!

If you were never to look at the intersection until proven wrong for not looking, wouldn't it be too late? It is the same in trading. You must protect yourself from any possibility in trading and not just protect yourself when the probabilities are high.

This will be the surprise side in trading The surprise side is a possible outcome but not a very high or likely probability like today's grain trade. When someone gives you a gift, you are surprised by it. Getting that gift was not a high probability. However, you are prepared for that surprise because you say, "Thank You!"

Most traders plan only for the probability side and that, to them, is always what they consider the winning side. This is the biggest mistake you can make in trading. Instead, you must plan for the losing side.
Read Full Post »

Thursday, March 10, 2016

Trading by Statistics

0
Especially while trading discretionary, I am pretty clueless about what I should be doing. What are the patterns on that chart? Are they telling me to go long or short, or am I just fooling myself that they are telling me anything at all? Since I am trading discretionary, it is my discretion to decide when to do what. Isn't it? Or if I already knew what is to be done, then where is the discretion?

(While trading mechanically, at least I have pre-decided rules and hence know what exactly is to be done in each scenario, though the rules themselves may be pretty clueless.)

Now, given that I am clueless about how to use my discretion, and half believe that the markets are somewhat random, how can I still trade? My (current) genius tells me to trade by Statistics. The core idea remains what is described in this post about System Hopping. I need to be profitable, have small drawdowns, and a high rate of capital growth. (Peace of mind is not statistically measurable though, I think)

Add to that the guidelines/core values/motto of whatever system.... and I know that I have to take trades with small Stop Losses, and the high Win Rate. How many losses I log before I net a big win counts more than where I enter trades. It's all about the Payoff Ratio and the System Drawdown. I need to keep my wins much bigger than my losses and reduce the frequency of losses. Let the graphs and probabilities on the Statistics page tell me what to do, rather than the Price chart. Let the numbers scare me into booking a profit, or calm me into relaxing my Stop Loss. The objective is to get the Statistics to look better.... and increase the probability of ending the day positive.


Trading by Statistics


Read Full Post »

Wednesday, February 3, 2016

House Money Effect and Intra-Trade Drawdown

0
I have been (officially) trading the Range Compression Trading System since January 6.... but I have been trading the system even earlier. In November, I was mechanically trading this very same system, but with somewhat different rules. Even in the first few days of January, when I was not trading the Range Compression Trading System, I was still marking possible entries on the charts.

This system does have a major flaw, if I may call it that... at least psychologically, and even mathematically, I view it as a handicap. With the current mechanical Trailing Stop rules that I use for the Range Compression Trading System, it is given to huge intra-Trade Drawdowns.

I have written about this earlier, and my rough estimate for intra-Trade Drawdown in January was about 15% of the Nifty scrip value. What is the problem and why is it affecting me? If it is a problem, why am I not fixing it? If I am not gonna fix it, then why am I worrying about it?

If I had the answers to these questions, then I would have already fixed it (obviously... probably?). Right now, I can only think of one reason - House Money.


House Money Effect - Source:Pixabay


House Money Effect


House Money Effect is the tendency of people to spend/risk income and profits from unexpected or recent sources more easily than other money. Though this term is generally relates to gambling casinos, where gamblers are more inclined to risk gambling gains on bigger or riskier bets, it is also common to see the general public spend a new bonus/windfall money more easily - on treats for friends or gifts, because they still have to get used to the fact that it is their own money, or even because of social expectations.

In terms of trading, this results in the tendency of a trader to take bigger or riskier trades with profits. In my specific case, it even means giving up profits - and additionally booking a loss in its place. How crazy is that?


Data and Analysis


The data of all intraday trades that I have done using the Range Compression Trading System in 2016 indicates my proclivity to give away House Money. Here, I am referring to unbooked Profits - that which is not mine, but is mine at the same time. (The term is unbooked Profits, as opposed to notional profits, since I could easily book them at or near the peak.)

The average MFE (Most Favorable Excursion) per trade is about 31 points, and I generally book 9 points out of that. The peak intra-Trade Drawdown is -23 points per trade - which means that in every trade, I watch the trade lose 23 points and do nothing about it. Around 10% of the time, I watch it lose over 40 points, and 27% of the time I watch the trade lose over 30 points and do nothing about it. Again, let me stress that I am day trading, and 30 points is about 0.4% of the scrip value.


Psyching about House Money


When this happens, and I, as a day trader who does not know what tomorrow brings, watch myself giving up a large part of my unbooked Profits.... then there is a lot of psychological pressure to do things differently - to attempt to capture the Profits at or near the peak. However, as a Systematic Trader, I am constrained to do what my System Rules tell me. In case I did not mention it earlier, let me tell that this Trading System has not been backtested.... so the only thing that keeps me at it are the live results. And that becomes really difficult when I hit a bad losing streak like the one which I am in right now.

When on a winning streak, it is easy to justify the House Money Effect, since money comes in anyways. But when you are on a losing streak, giving up the House Money, and then giving up some more, things are different.

So, again, why do I have to stick to a non-backtested system, giving up significant amount of unbooked profits, day after day, and week after week? Because I don't know better. Because the results until the current losing streak were good. When I have tighter Stops, I tend to be shaken out of big moves. Also, waiting for the wide Stops to be hit also keeps in a trade longer, and hence prevents me from overtrading.

Ok, enough psyching about this. I have put forward my justifications to myself to treat intra-Trade Drawdown as House Money. Time to watch how the Trading System psyches me tomorrow....
Read Full Post »

Saturday, January 16, 2016

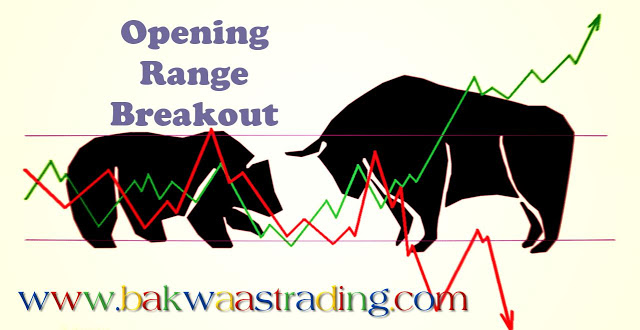
Opening Range Breakout - Day Trading like a Swing Trader

2
Opening Range Breakout or ORB Day Trading System is my perennial favorite. It is one of the simplest profitable Day Trading System that I have traded. It is a Day Trading System for the non-Day Trader, the busy executive who doesn't have much screen time, the Taxi Driver who places trades by phone without charts, and the student who doesn't bother about the intraday intrigues of the market.

I know because I was like them - place quick entry orders as soon as possible after Market Open, and scoot to work, and not bother about the market for the rest of the day. The result of the trade could be be checked at the end of the day anyway. And much to my surprise, money would keep coming - day by day, week by week, month by month... until the time disaster struck - like it always does.


Opening Range Breakout - Image Source: pixabay


Augubhai's ORB Trading System


Here are the basic steps of the system:
  1. Define an Opening Range Period - 1 minute, 5 minutes, 30 minutes, or even a Range.
  2. After Market Open, wait for the Opening Range Period to be completed.
  3. Place Stop Loss Entry orders, at the High and Low of the Opening Range
  4. That's about it... except for the exit. You get to set your own exit logic - If I was busy with work, I would try to wait for a few minutes for the entry to trigger on one side, and update the other order to place the Stop Loss at a calculated optimum value from the Entry Price. (For an Opening Range of 1 minute or 5 minutes, the entry usually triggered quickly. Else, canceled the orders, if the Opening Range was wide)


There are a number of methods for trading Opening Range Breakouts, the most famous of them is perhaps Tony Crabel's formula. Many of these methods are for scalping the Breakout or booking profits at targets. My method is more a fire and forget for the day - with a wide calculated Stop Loss, targeting the maximum, but taking whatever the market gives - Day Trading with the attitude of a Swing Trader.

I had given an outline of the system on the Traderji forum, and am pasting that verbatim below:
 
http://www.traderji.com/amibroker/52959-augubhais-orb-system.html#post540835
To answer the queries above - this is a simple intraday ORB system. ORB stands for Opening range break-out.

We decide on a period to watch - it could be the first 5, 10, 15, 30, 60 minutes - anything that you decide. Assuming that we decide that the opening range period is 10 minutes. At the end of 10 minutes, place a Buy Stop Loss order at the day's high(+filter), and a Sell Stop Loss order at the day's low(+filter). The filter need not be a big number, otherwise you could lose some part of a good move.

If the Buy Stop Loss gets triggered, you could either decide to leave the the Sell Stop Loss unchanged or modify it to a fixed percentage or a trailing Stop Loss. It is up to you to decide on the stock, filter, and method of Stop Loss once you are in position.

The premise is that we make the most profits during trending days. Generally, on trending days, the Open and Close are at near the extreme ends of the daily range, with minor pullbacks. So once you are in position, if you set your Stop Loss to avoid pullbacks, then you would get the most of a trending day with less risk. The key here is to decide on the Stop Loss. The Stop Loss will vary from stock to stock and period to period. The AFL will help you backtest and decide on the Stop Loss.

With whatever backtest I have done, the maximum returns were when there was no stop loss. Obviously, that is more risky, and I never trade without a Stop Loss.

This is not something new that I discovered. You will find so many ORB systems on the internet. What I want to share is that I have been profitably trading this system successfully for many years now - on NIFTY and recently on Bank Nifty. (Sometimes there have also been very serious whipsaws as well).

This is an Intraday method that does not require any charts. You just need to know the day's high and low at the end of the opening range period. You also do not need any AFL, except for backtesting.

Hope this answers your queries.


Rationale


The rationale for this system is already mentioned in the snippet above. It is to capture days when the open stays near one extreme (High or Low) of the daily candlestick bar. The number of such days, and the potential points to be made trading this system on such days is huge. Around 60-70% of the time, either the day's high or low is made within the first 60 minutes. If the Opening Range is 5 minutes, then this number reduces to around 20%, but you get to capture more points when you win (Don't take my word for it - Check these out on your charts, and see what's the percentage that you get. This is not very difficult to verify.)

Again, here's my post from Traderji:

http://www.traderji.com/day-trading/89936-opening-range-breakout-orb-intraday-trading-system.html#post867878
OK, here's the thinking behind my method of ORB...

Open the daily chart. How many bars do you see that open at one end and close at the other end? If we capture even some of those bars, could we be in profit?

I traded this mechanically, but if we are smart, we can get better results.


Warning


So, everything is hunky dory so far. But then comes the twist in the tale. You get to win only around 20% of the time. That means that for a random series of 100 trades, there is a 18.5% chance that you could have a continuous losing streak of 20 trades (Check this out with a Streak Calculator). Will you be able to handle this sort of a losing streak? I certainly cannot, at least not at this point - which is the reason that now I don't trade Opening Range Breakout the way it is described above.

Opening Range Breakout or ORB is my first and favorite Day Trading system. My first love. It is with ORB that I had my first Day Trading success - months of big profits, and then I was hooked. Then it all went bad in a few days - poor Money Management being a major reason. There is need to be aware of the risk of huge drawdowns trading the system mechanically as described above. Use it at your own risk.


Trading Systems


I am kicking off this series of posts on Trading System and Methods with my notes on Opening Range Breakout. These are just notes and not a comprehensive review. Maybe, I'll flesh out more details about this Trading System as I continue posting...


Read Full Post »

Monday, December 21, 2015

20151221 - Default behavior

0
Today, I had a simple but tough-to-implement plan. But early on, when I did not get any entry signal with the plan, I fell back into my default behavior. My default behavior is find a set of rules that have a statistical or visual +ve expectancy, and trade it mechanically to death. Then when a whipsaw occurs, I begin the process all over again.

Today, I traded the "fewer trade" variation of the SAR system that I used on Friday, which meant that I missed the opening move.


Day Trading: Nifty M3 Candlestick Chart


Read Full Post »

Friday, December 18, 2015

20151218 - The Casino Effect

0
Today, I was busy with other stuff. Fully aware of the risks involved in mechanically trading SAR without being at terminal, I decided to play it with one lot....

There were 2 versions of this SAR system - one that trades more being SAR all the time, and the other that trades less by not being in trade all the time. Both are good and profitable over the LOOONG term. I chose the first one today. Today, was not the day. Even with 1 lot, it's a big loss.

I have tested n number of mechanical systems. Many of them are very profitable over the LOOONG term, but the drawdowns are severe (also when compared to discretionary systems). They have to be played for the long term, but the drawdowns limit the margins that can be utilized, and ultimately the returns for these systems.

So, until that series of big wins start pouring in with these systems, I trade with hope of that happening, just like in casinos. And when the series of big wins happen, margin utilization is increased, in the excitement of it all. Bet big until all is lost. Just like in casinos. End result: The system remains profitable in all backtests, not me.

There is no way that I cannot acknowledge that I have a problem to solve... What will I do about it? TBD.


Day Trading: Nifty M3 Candlestick Chart


Read Full Post »

Sunday, November 29, 2015

The Value of Nothing

4
diamond-of-the-century


Really??! It's just a big stone. Give that diamond to us speculators, and we will find it's value. We will bid and ask different prices, but we will find the value. We don't really care about the value, but we will find a Price. Price is what matters to speculators.

Why is a diamond valuable? (Actually, why is anything valuable?, but we will address that bigger question later.)

When we were kids, we used to collect those nice smooth or shiny pebbles, didn't we? And cry if we lost a pebble, fight for it, protect it, steal it? But then we grew up..... and realised that stuff wasn't worth much.

Guess what. Mankind still has to grow up. We still strive to own these useless pieces of stones and metals (they do have industrial uses and we can throw them at wild animals when they attack us, but that is not what we value them for).

Settlers could rob natives of things like land and country (and people/slaves), in exchange for bright beads and clothes, because the natives valued those beads... and not iPhones. Unlike those natives, we value money, those pieces of paper, metal coins, IOU notes, virtual money (as if the rest is not virtual), because we believe a goverment or something has guaranteed their value - when most of the time there are no assets to back them. Random names/places/animals/things are valued, and sometimes worshipped.

Monkeys don't value those stones as much as us. That gets me thinking... maybe our society/civilization is built or based on stuff that I think don't have value. Don't we value our culture/civilization? If we stop valuing a random stuff that we value now, then that basis of our society/culture/civilization will change.

Diamonds and modern art will continue to be valued by society for more than a generation. People who fight to own them will not appear as silly as the children who grew up, because society will not grow up enough in their lifetime.  Could the value disappear in a generation?.... then they would look silly like those who were in the Tulip mania or Dot Com mania or the craze for a Justin Timberlake ticket?


Diamond of the Century


Read Full Post »

Friday, November 27, 2015

The Power of Compounding

0
Yes, it's the very same thing that we all learned in school. However, in the heat of trading, we tend to forget this simple principle. So, here's a reminder. Consistently earning even a few points everyday will make a trader rich.

Below, I am pasting verbatim what I posted on the topic on my thread in Traderji. Note the need to deploy full capital to get the results indicated. As mentioned in the post, a high win % and low risk per trade would be great. However, I am now thinking that high Recovery Factor and low risk per trade would be a better criteria to give the confidence to deploy maximum capital.

Recovery Factor = (Net profit) / (Maximum system drawdown)

The Power of Compounding

NF is at 7700. If you are able to net 10 points per day, then you are earning 3.24% on margin on MIS basis, and 1.62% on NRML basis.

If you have a high win %, and low risk per trade, and deploy full capital on each trade, then with NRML your capital would have multiplied 24 time in an year. With MIS, then your capital would have multiplied 588 times.

I am assuming that you are able to trade 200 days in a year.

If you earn 0.1% of capital everyday, compounding your capital will make it 1.22 times after 1 year.
If 0.2%, 1.49 times.
If 0.3%, 1.82 times.
If 0.5%, 2.71 times.
If 1%, 7.32 times.
If 2%, 52 times.
If 3%, 369 times.
If 4%, 2550 times.
If 5%, 17292 times.
If 6%, 115125 times.
If 7%, 752931 times.
If 8%, 4838949 times.
If 9%, 30570292 times.
If 10%, 189905276 times.

Get the drift? Now don't find excuses. Just do it  emoticon-tongue-src-wikimedia


Read Full Post »

Thursday, November 5, 2015

System Hopping

0
I change my trading methodology frequently. I was doing discretionary trading in the October series. Now, I am trading the November series mechanically.

Whenever I trade a system, I hope that it will work out well, and for a long time. But soon, I get disillusioned and change my trading method.... mostly because of a losing streak, but many times simply because I don't like system behavior in further back tests and scenario tests.

At this point, I really don't care about the systems, as long as certain criteria are met. And the criteria itself is not well defined. However, from the top my head....
  1. Profitable
  2. High rate of growth of capital
  3. Small drawdowns
  4. Peace of mind/Less screen time
As long as I make money, hopefully fast and with low risk...

I have posted thoughts related to criteria in my Bakwaas Trading thread on Traderji.


Read Full Post »
satta king