Friday, December 2, 2016

This week's Paper Trades - Nifty Futures

The mechanical day trading system that have been using since August has been giving good results. It is the princess that I found. However, it does not give trading signals every day. My backtests with it indicate that it trades between 5 to 14 days per month. In November, it gave me 7 trading days until 15th November, and then no more trades for the rest of November.

I have been evaluating additional day trading systems. One of the systems that looks good is a filtered version of my Opening Range Breakout, but even that filters out many of the trading days.

To fulfill my itch to trade daily, I decided to test other systems. Currently, I am paper trading on the 5 minutes timeframe with 35 EMA. Many points of the system are inspired by Smart_Trade's Swift Trading System. The lines (Decision Points) on the charts are mostly according to the Decision Points Trading method. Although inspired by the those methods, the way I have been paper trading is markedly different.


Why Paper Trade?


I am not used to paper trading. In fact, this is the first time that I am paper trading. Earlier, whenever I needed to 'live' test a system, I would put in real trades with at least 1 lot. That was when I was kissing princesses, but nowadays I am kissing frogs - so I would need some real confirmation before putting in real money.

I could have just restricted the evaluation to backtesting, but there are many reasons why I am paper trading this system. First of all, it relieves boredom, and gets me feeling involved with the market. Secondly, there is no system. The system rules are still work-in-progress and completely fluid - even discretionary. I could have run multiple backtests, and each time still felt that a different tweak would be better. When I paper trade in real time, at each twist of the market, I decide my trade levels/actions, just like I would do in real trades. Whatever tweaks I may do to the system later, are not going to change the real time paper trading decision that I took.

Thirdly, backtests, even a bar-by-bar replay is cannot show me how the chart appeared in real time, since the time frame is 5 minutes, and I only have 1 minute historical data.


How I Paper Trade 


Fourthly, I am totally involved (to the extent possible) while paper trading. I am totally honest to myself while paper trading. I could have been wishy-washy, and decided on the trade that I would/could/should have taken after the event. I could have been indecisive and confused in real time, and later decided on the action that I would have taken. But no, I am being honest to myself, and my paper trades happen only in real time, and those are what are marked on the charts.

I even got those queasy feeling when the paper trades were not going right. I was very uncomfortable with the paper trades done on Thursday and Friday, when they were not going well, almost as if they were real trades (to the extent possible)


Limitations of the Paper Trades


Paper Trades are after all, not real trades. However, honest and well intentioned I may be, they are still not real trades. In real trades, there's going to be slippage, there's going to be missed trades, missed fills, none of which appear in the paper trades. Also, paper trades can only take into account the ticks that appear in the data feed. Missing ticks that do not appear on the charts, could trigger trades in real time, and completely alter the trading system results. I have the feeling that at many points in my Paper Trades this week, my Stops would have been hit, except for those missing ticks.

Also, however honest I may be to my myself, my feelings will often be different when real money is on the line than while I am paper trading. While paper trading, I do not look at the charts all the time, and mainly observe the bars during bar close or a on significant price movement. My intention is to behave in the same manner if I trade the system with real money, but who knows whether I will be able to restraint myself?


Paper Trades on Monday, 28 Nov 2016


1 trade, +19 points (pre-costs)

This was my first day of paper trading. The EMA indicated a continuation of the uptrend. I went long above the pivot inside the Initial Range, and exited on channel break after multiple attempts to push higher. With my subsequent tweaks to the system, I probably would have delayed the entry until the high of the Initial Range was broken, but the chart shows the decision that I took in real time.

Paper Trades - Nifty Futures - Monday, 28 Nov 2016


Paper Trades on Tuesday, 29 Nov 2016


4 trades, +22 points (pre-costs)

With my subsequent tweaks to the system, the first trade entry would have been iffy and probably delayed, the 2 losing trades would not have been taken, and the last trade would probably have been delayed.

Paper Trades - Nifty Futures - Tuesday, 29 Nov 2016


Paper Trades on Wednesday, 30 Nov 2016


2 trades, +37 points (pre-costs)

Caught a nice move with the second trade, though the entry was perhaps delayed.

Paper Trades - Nifty Futures - Wednesday, 30 Nov 2016


Paper Trades on Thursday, 01 Dec 2016


3 trades, +5 points (pre-costs)

Was not much bothered by the first trade, but the wide Stops for trades 2 and 3 gave me the queasy feeling that I mentioned earlier in this post.

Paper Trades - Nifty Futures - Thursday, 01 Dec 2016


Paper Trades on Friday, 02 Dec 2016


4 trades, +16 points (pre-costs)

Nothing worked. The exit of trade 3 was a nice Breakout Failure entry in the Decision Points Trading method, but the way I have currently tweaked the system rules did not allow me to enter short until much later.

Paper Trades - Nifty Futures - Friday, 02 Dec 2016


Next steps


I am already backtesting this system (with fluid rules) on historical data. I hope to continue that this weekend. If my backtests are satisfactory, I might continue to Paper Trade this system for some more time, or even trade it with 1 lot. If not, I should drop the frog and move on.


Update on Dec 13, 2016:

weil ich habe keine Lust


I have given up on this system, at least for the moment. I was happy with the paper trading results at the end of the first week - trades which are shown in this post. The plan then was to paper trade for one more week and then begin trading the system with a single lot. I also wanted to mechanize the system as much as possible.Sadly, that is not how it worked out.

Click the link below to see all my paper trades with this system:

An additional reason why I am not to keen on continuing with the paper trades is that my current live day trading system has again started giving me frequent trading signals.


Thursday, November 17, 2016

Super Stupid Option Premium Skew

Now, this is irritating. Nifty Spot closed at 8090.95, and Nifty November Futures closed at 8075.25. Now, December 2017 Nifty 9000 Call that is 909 OTM is available at around 337, and December 2017 Nifty 8000 Put that is 91 OTM is available at around 338. Why is a 909 OTM option and a 91 OTM option available at the same price?


Market Depth - Nifty December 2017 9000 Call
Nifty December 2017 9000 Call - 909 OTM for ₹337


Market Depth - Nifty December 2017 8000 Put
Nifty December 2017 8000 Put - 91 OTM for ₹338


These LEAPS options do have sufficient market depth to allow accumulation.

I might be wrong, but I think that 8000 is considerably closer to the the current Nifty Spot Price than 9000. Do the big option players think differently? Why is there a persistent skew overpricing Calls in comparison to Puts? What am I missing?

Isn't there free money here, like I have posted about the Premium Skew in July this year? I have been periodically observing the Premium Skew, for at least 3 years now. I had even attempted to trade it once, but got bored after a couple of months (See my post in Traderji about it). I just don't have the patience needed to pull it off. Maybe, it does not match my temperament, or maybe it is just that I don't have sufficient capital to make a big killing on it, or maybe it's just that I have got better stuff to do ☺

Or, maybe I just don't understand this stuff at all. Such is life.... Skew my life!!


Wednesday, November 16, 2016

Better Opening Range Breakout - the Overnight Gap setup

In my earlier post about Opening Range Breakout, I had mentioned a very simple way to trade the Opening Range Breakout. It was a simple trading system, where upon completion of the ORB period,  entry triggers were placed above and below the Opening Range.

That system had a positive expectancy - both in backtests as well as real trades. I mainly tested and traded that system on Nifty50 futures. The issue with that system was that it was given to huge drawdowns. With optimizations, the win rate ranged between 20% to 30%, with a reward-risk ratio of 4:1 or more.

I have been testing Opening Range Breakout with different parameters, and one of the obvious tasks is to attempt to improve the win rate to minimize drawdowns. This process is still work-in-progress, but let me share one of my findings.

The tests were done on the NIfty50 Future data of the last 4 years. I find that if Opening Range Breakout trades are taken only when there is a significant overnight gap, with a few optimizations, the win rate jumps to between 50% and 55%, though the reward-risk ratio goes down to between 1.6 to 2.0.

Compare the 2 results:

System   My Old ORB System    ORB with overnight gap filter 
Win Rate 20% to 30% 50% to 55%
Reward-Risk Ratio 4.0 to 6.0 1.6 to 2.0


I have given ranges for the Win Rates and Risk-Reward Ratio, but keep in mind that the Win Rates and Risk-Reward Ratios generally have a inverse relationship. So if I optimize the old system for a Win Rate of 20%, then the Risk-Reward Ratio would be closer to 6. Similarly, if I optimize the old system for a Win Rate of 30%, then the Risk-Reward Ratio would be closer to 4.

Which system would you choose? Applying the Kelly Criterion to maximize returns, the choice would generally be to go with the overnight gap filter.

While using the old ORB system, the Kelly Criterion would restrict the capital risked per trade to between 6% to 12%  and have an expected return of 2 to 10 times the initial capital per 100 trades. (The results that I got while trading the system were closer to 2 than 10). With the Overnight Gap filter, due to its higher win rate, the capital risked per trade according to the Kelly Criterion would be 15% or more, giving a minimum expected return of 25 times the initial capital per 100 trades.

But again, let me put the disclaimer. There are no minimums in trading. If you have the bad luck to hit a bad drawdown, or a big slippage, or makes typos, or go psycho... then there are no minimums... psycho gamblers especially have the talent of getting account balances below zero very quickly. Even ignoring all the bad luck and bad psychology, there is no guarantee that the market will continue to behave the way it did in the past to make Opening Range Breakout a successful Trading System. These are estimates based on past data, and not a prediction of the future performance.

Below, is an image on the how the ORB trades with overnight gap filter panned out on the November Nifty50 H1 charts. The Yellow bars indicate the days on which the setup occurred.


Opening Range Breakout with Overnight Gap


I have also found a few setups that can increase the expectancy of Opening Range Breakouts further... but the study is still in progress.


Thursday, November 3, 2016

Kissing the frog - Trading System evaluation


The Prince of the Markets


Once upon a time, not so long ago, there was a Prince (in reality, a pauper) called Augubhai, who was attracted to every Trading System that caught his eye - as though the Trading System were a Princess. He would embrace the Princess whole-heartedly, close his eyes and kiss her - only to realize that the Princess was a frog, when he opened his eyes.

Disappointed, but not disheartened, he would muster vim, and with renewed vigor, he would resume his search for his ideal Princess. And then he would embrace her whole-heartedly, close his eyes and kiss her - only to realize that it was a frog - like always.

The Prince was smart fellow (in reality, a stupid fellow - but this is a fairy tale). One day, while thinking with the core logical part of his left brain - just as logically as Archimedes did long, long ago - he had an eureka moment. He realized that every time he kissed a Princess, it turned out to be a frog. So, logically, if he kissed a frog, it should turn into a Princess. It was so logical a postulate, that he was surprised that it took such a long time for a smart fellow (in reality, stupid) like him to discover it.


The reality of the Markets


But the Prince finally realized that his postulate was not working. As they say, the reality of the markets is different from the reality of logic and reason and Archimedes. As they also say, it is yucky, and not easy to kiss frogs. Kissing frogs did not turn them into Princesses - at least, not too often. Kissing frogs needs you to discard irrational exuberance that this one will be a Princess. But you also need that little hope - a low probability hope - that there would be a Princess somewhere out there. This hope is not like a exuberance of a lottery buyer, because kissing frogs is much harder than buying the lottery.

The Prince stopped trading every random Trading Systems that seemed visually, logically and/or emotionally pleasing. Trading Systems that appeared to be visually, logically and/or emotionally pleasing seemed to be Princesses, but in reality, most were frogs. The records of the Prince trying out random Trading Systems, day after day, month after month, year after year can be found in the Princess Diaries in the Traderji forum:


Persistence and Perseverance


Now the Prince takes a hard look at Trading Systems before trading them, backtesting and scenario testing them, before actually trading them with money. After all, these Trading Systems are mostly frogs, and frogs rarely turn into Princesses. The spirit of what the Prince does now is similar to what he describes in these pages at Traderji: http://www.traderji.com/trading-diary/90116-dasara-system-49.html#post918162.

The Prince has even frog-zoned the Opening Range Breakout system, at least for now. Even the Range Compression Trading System that he traded earlier this year is out of his embrace. These systems were really beautiful, enticing.... closer to being Princeses than frogs. But Princesses need more refinement and polish, and maybe with some refinement these Trading Systems may turn out to be real Princesses.


Hope... hopefully, not irrational


Fairy tales do not have sad endings... and neither does this one. The Prince actually did kiss a frog that turned out to be a Princess. That is the Trading System that the Prince trades currently. With the application of the Kelly Criterion, the Prince thinks that he will soon amass wealth and riches far beyond his imagination. But the due to past experiences, the Prince has the nagging fear that this Princess would also turn into a frog one day. To mitigate the fear, the Prince continues to evaluate other Trading Systems, continues to kiss frogs in the hope of finding more Princesses to enhance his harem.

One probable reason why the Prince went on the Princess kissing spree earlier, was because he did not have a Princess, and was desperate to find one by any means. Now that he already has a Princess, he is now more choosy and strategic about kissing frogs.... well, at least this is what his psychologist thinks.

Fairy tales have morals. What do you think is the moral of this story?


Friday, October 21, 2016

Kelly Criterion - Position Sizing to Maximize Returns

Recently (since August 30th), I have started using the Kelly Criterion to decide the position size of my day trades. I have known about the Kelly Criterion for a long time, but have only had the confidence to use it now.

Why now? 'Cause, I have spent hours on backtests, and finally seem to have arrived at a trading system that gives consistent results over a few years, and gives me enough confidence to decide the p and b needed to calculate the position size according to the Kelly Criterion.

How confident? We will come to that later...


Kelly Criterion (Wikipedia link)


f = ( p * ( b + 1 ) -1 ) / b


where,
f = optimal fraction of capital to be risked to maximize long term gain
p = probability of winning (Win %)
b = expected reward per unit of risk (Risk to Reward Ratio)

As long as you know your p and b, risk f.


Kelly criterion - Why NOT?


Open any article about Kelly Criterion - not excluding the Wikipedia article - and you will find many reasons/arguments given to avoid Kelly Criterion. These include everything from the fact that you cannot predict the future, to the gambler's/trader's tendency to overestimate system performance, to reducing volatility of returns, to expected utility, to etc. etc. etc....

Also, to not incite novices and gamblers to risk ruin. (My risk disclaimer is at the bottom of this page)

From what I understand, I think that the Kelly Criterion was originally designed to determine the optimal bet sizes in scenarios where you know/assume the odds and probabilities. How do you apply it to markets that are dynamic? How do you determine the odds and probabilities? (The odds part may not be an issue for systems that have predetermined entries, stops, and targets)


Kelly criterion - Why not?!! 


Below, is an example that I had earlier posted in the Bakwaas Trading thread of the Traderji forum...


For example, if a system has a Win % of 50% and Risk to Reward Ratio of 1.6, then the optimal risk according to the Kelly Criterion is 18.75% of compounded capital on every trade.

- If we risk 19% per trade, then after 100 trades, the capital will be 15.42 times the initial capital (1442% return on capital)
- If we risk 18% per trade, then after 100 trades, the capital will be 15.36 times the initial capital
- If we risk 15% per trade, then after 100 trades, the capital will be 13.87 times the initial capital
- If we risk 10% per trade, then after 100 trades, the capital will be 8.61 times the initial capital
- If we risk 5% per trade, then after 100 trades, the capital will be 3.61 times the initial capital
- If we risk 2% per trade, then after 100 trades, the capital will be 1.76 times the initial capital (76% return on capital - not too bad)
- If we risk 1% per trade, then after 100 trades, the capital will be 1.34 times the initial capital (34% return on capital)

Oh, I forgot to mention what happens when we increase the risk beyond the optimal %.

For the same parameters as above,

- If we risk 20% per trade, then after 100 trades, the expectancy is that capital would be 15.25 times the initial capital
- If we risk 25% per trade, then after 100 trades, the expectancy is that capital would be 11.47 times the initial capital
- If we risk 30% per trade, then after 100 trades, the expectancy is that capital would be 5.86 times the initial capital
- If we risk 40% per trade, then after 100 trades, the expectancy is that capital would be 0.45 times the initial capital (55% loss of capital)
- If we risk 50% per trade, then after 100 trades, the expectancy is that capital would be 0.01 times the initial capital (99% loss of capital)
- Risk above 50%, then after 100 trades or lesser, and have the expectancy of losing 100% of your capital!!

 Would I not choose a 1442% return over 76% return? Why not?!!


Anti-Kelly reasons (excuses?) 


The problem is that we are unsure of the future win % and RR ratio of trading systems. I guess that is the reason most books recommend 1-2% risk.

The return with 19% risk looks grand... but there could be practical difficulties.

1. Will the Win % and RR ratio of the system hold into the future?
2. What happens when the system hits a continuous losing streak? According to calculations, we should still continue to risk the optimal risk %, if the system will get back to the Win % and RR ratio in future.
3. Margin requirements may limit position size, and not allow optimal risk.
4. The market/s may not have sufficient liquidity to allow compounding of position size.
5. With increased position size, slippages and fills may be affected. This will also impact the Win %, RR ratio, and % of Capital risked.

Points 4 and 5 only become relevant when the position size increases significantly. For a small trader, only question 1 to 3 are relevant, and the answer is that we should try to risk close to the optimal risk to get better return on capital. Notice that even if the system performance deviates slightly, the optimal fraction will only vary slightly.


p and b - The indispensable criterion to apply the Kelly Criterion


Read the formula again.

It says that for a given p and b, risk f
Risk f, only if you know p and b
If you do not know p and b, you cannot find f.

f = ( p * ( b + 1 ) -1 ) / b


where,
f = optimal fraction of capital to be risked to maximize long term gain
p = probability of winning (Win %)
b = expected reward per unit of risk (Risk to Reward Ratio)


Friday, August 5, 2016

Trailing problems Part 2 - Day Trading: August 05, Intraday

Trailing

Was short almost all through the day. Made 4 losses, when I could have restricted myself to 2 losses - or even 1 loss and 1 win, if the trailing was better. Since Wednesday, I switched to a mechanical trading strategy. The reason for going mechanical is to keep my sanity instead of worrying about stops all the time, but right now the mechanical trailing is what's driving me crazy.

On Wednesday - another 100% loser day - I never got a chance to trail. Yesterday, mechanical trailing caused me to exit early from trade 2, and caused me to take 2 more avoidable shorts. Today, read the story below....


Nifty M3 Price Action Chart


Initial Spike and Ledge

Gap up opening - note that the low of today's open was exactly the high of yesterday's open. Then, it consolidated, and there was nothing to do - patience, patience... Placed short trigger below Breakout of consolidation. As the price moved, I began thinking of a Breakout Pullback Long above the Breakout Bar, but Price zoomed up suddenly before I could complete the thought and the moment was gone (I guess, I am a slow thinker).

First Trade

Then, inexplicably, for all my talk of patience, I entered Short below the Inside Bar that followed the long green bar on the M1 chart. Initial Stop was 8687.9, but my mechanical Trailing Stop rule brought it down to 8686.85. Guess what? Price formed a cigarette, then made a high of 8687.7 (at least on my chart), and stopped me out. Bonus, I got to blame my mechanical Trailing Stop rule.

Cigarette, Ash and Smoke

The next 3 trades were all shorts as the Price came back to the cigarette zone after taking my Stops. In Trade 3, the cigarette ash fell, and there were 20 points to be locked - again the mechanical Trailing Stop rule prevented me from doing it. The last trade should have been avoided (in hindsight). All the while, the price was grazing the cigarette high so many times, that I would have gone long expect for the fact that 8700 was close by. The cigarette high was also 8650 Spot, that had moved 10 points lower since the start of the cigarette.

When finally the cigarette smoke went up, I still tried to short.


Thursday, August 4, 2016

Trailing problems - Day Trading: August 04, Intraday

Storm and calm

I stayed aloof of the morning volatility.... patience, patience, patience is a virtue.... Took my entries during the calm following the storm, with a lot of patience. I have changed my trailing stop method, but this one whipped me too into bad results.


The perfect entry

So, after the morning dip to 8550 (ohh, what a miss. schade), and the pullback to 8600, there immediately followed a neat Price Action set-up for short (marked on chart). I decided to wait for a better set-up, which I defined as one more pullback to 8600 and higher volume before falling. That perfect trade occurred, but you know there is nothing like perfect. So, I soon made a loss. But, as they say in Venezuela, lightning always strikes twice. As soon as there was a higher volume Pin Bar above 8600, I had my next perfect entry. This one moved, but my Trailing Stop got hit.


Nifty M3 Price Action Chart


Trailing problems

Ignoring yesterday, on all the other days of these series, I have been able to catch (or at least identify) the top before the major down move of the day. Even yesterday, I can claim that I did identify the top... only decided not to act there. Despite catching the tops, I have not been able to maximize points because of poor trailing. I decided to trail differently today, but the results were no different.

Lightning struck twice again

The third trade was the imperfect entry. I was in a hurry to re-enter the down move, and did not wait for higher volumes on the M1 chart. Heck, I did not even wait for the bar to complete. Also, I thought that price had traded in the 8605-8587 band for too long, and there was pressure to go down - just another reason that I invented to go short. Immediately, a higher volume bar took out my Stop Loss. But it was a higher volume bar, good enough for me to re-enter at the same point... another perfect entry. All that these trades did was to reduce the points I earned. Trailing on Pivot Highs would have worked great today.... but who knows about tomorrow?

The bounce

There was a bounce without even testing 8550/Low of the Day. I was not happy, but the big green bar and the Price Action that followed was tempting, and I placed a long trigger there. Later cancelled it. When the price came back to that point, and did a small wriggle there, I entered long. This was another imperfect/impatient trade, but I got some points at auto-square-off.

Spot Price

The Spot 8550 was about 20 points above the last entry. I probably would not have entered if it was closer. During the day, Spot 8550 moved from below Previous Day's Close to above the 8590 Pivot Low area.


Note/Disclaimer:

1. If these notes do not not make sense to you, it's because they are mainly for my personal consumption. These notes make sense to me, and at some point I hope that my writing improves enough to make sense to others...

2. The volumes that I talk about in this post can be seen better on the M1 chart.


Fear - Day Trading: August 03, Intraday

Bad day

I did not post yesterday, because I was disappointed. There were too many trades, and ALL THE TRADES THAT I TOOK were losers. Did not take some trades that could have been winners (hindsight). There were also a couple of trades that I took, that would have been winners (hindsight), except for tight Stop Losses. A day everything was bad for me....

I had also decided to change my Stop Loss trailing strategy, but never got a chance to move Stop Losses even once. Haha.

GST anticipation

It was the day of the GST bill being presented in the Rajya Sabha at 2 PM, and looking at the chart it appears that that news affected me more than it affected the market. My bias was long for the GST news.

Fear, Justification, and Coulda-Woulda-Shoulda

There were 2 kinds of fears that affected my trading. One was the Fear of Missing Out (or is it Greed?) that made me take trades in anticipation of news based big moves. The other fear was the Fear of Increasing Losses that caused me to not place trades at locations where I otherwise would (probably) have profited. But if any of these trades had turned winners, then I probably would have had a justification about why that was a correct trade.... or probably not. I dunno, man.

In any case, I was not patient. If I had been patient, as I had intended, then I would have had a maximum of 1 or 2 trades, or even a no trade day. When I started discretionary trades in this series, my clearly stated objective was to be patient, take trades only on great set-ups, even if I missed on many good trades. Clearly, I have failed in that objective.


Nifty M3 Price Action Chart


The initial down move

I took the first trade early, right below the first M1 bar low. After all, it was GST day. That trade failed in less than a minute. It caused me to avoid the next 2 opportunities to short. Missing those 2 opportunities caused me to take the next trade early. I took the second short after a pullback, without waiting for break of 8600. I thought it was a fast moving market, with higher volume bars, on GST day. Fear (Greed?) of Missing Out was in play. And it was indeed a moving market with volume. Look at the volumes on the first 10 bars.

The bug of god

I placed a long above the Pin Bar that bounced from 8600... and immediately regretted - I did not want another loss. Somehow, like magic, the order did not appear on my terminal. And I thought that god had appeared in the form of a software bug. That fear of loss dominated until a good up move and a good down move was complete.

Price Action at 8600

After a Master Candle at 8600, pullback short failed. Breakout Failure long lasted longer, but failed.

The next trade was a pullback short. Though my bias was long, I took an early short based purely on the Price Action. I should have waited. Then, I ignored the Breakout Failure long.

Action during GST debate

Really, there was not much action. There was a higher volume bar just before the bill was presented. My bias was long, so I went long above it for a loss. Then went short below it. That short would have worked well, except that my Stop Loss was hit!! Stopped trading after that.


Now, that the GST bill has been passed, I think that market will open higher. I have not looked at SGX Nifty yet... let's see how good my judgement is.


Tuesday, August 2, 2016

...And then, I lost patience - Day Trading: August 02, Intraday

Good day turned bad

Day was going good, and then it took a bad turn. I know that it was impatience that ruined it, but am still not thoroughly convinced that impatience was unwarranted...


Nifty M3 Price Action Chart


The initial volatility

The day began with a normal inside bar, but from the second bar onward things became volatile. I guess that was due to the anticipation about GST. I am a little surprised by the limited impact of the GST news today. Anyway, I watched the M1 chart (see chart below), but overcame all temptations and sat on my hands.There were so many setups, but I thought none was good enough given the volatility.


Nifty M1 Chart - Initial Volatility and Trade 1 Entry


The first trade

The first trade was a breakout failure of the resistance during the initial volatile period. Though I haven't drawn the resistance line on the chart, it is probably clear on the M1 chart above. Also, a couple of bars on the M1 chart painted higher volume and eased me into the trade. The trade moved well. As soon as it touched 8700, I tightened the Stop Loss to 2 points above entry. My target was a close below Yesterday's Close - which was also 8650 on Nifty Spot. When that was achieved, I was not happy with the Price Action there, and decided not to move my Stop Loss. Finally, moved Stop Loss to +20 when the Pivot Low below Yesterday's Close was broken. Stop Loss triggered at 8690.05 and filled at 8692.4. Maybe, Stop Loss at 8690 would have been better. I hate slippages, but trade SL-M most of the time....

The second trade

The first trade exit could also have been a SAR, but I desisted because 8700 was close. Took the second short when the Lows broke again. This move bounced back from the Day's Low, and that was a good set-up to reverse to Long. But I decided to be patient, and wait for a better set-up. Even that appeared a couple of bars later, but I decided to hold. Finally, took a loss of 2 points on the trade. After yesterday's loss, I am persuaded to tighten my Stop Loss to minimize loss whenever there is a move in my favor. In yesterday's loss, I had a MFE of +18 points, but took a loss of -9 points. Even this trade had a MFE of +16 points.

The third trade - TST

The third short was a Test of Yesterday's Close/8650 Spot. The reason for the trade will be clearer in the M1 chart below. The target for this trade was 8650 on Futures. I was patient and did not move my Stop even when it reached a +20 without touching 8650.


Nifty M1 Chart - Third Trade and Impatience


And then, I lost patience...

When price bounced up from 8650, and formed a Pivot above it, I quickly lowered my Stop from 8659 to 8657 and reversed to long. In hindsight, it was a pretty stupid move to lock in just 2 more points, especially when the trend was down. But you never know when price reverse (like I missed the Breakout Failure Long at the same price yesterday). Let's agree that it was stupid though to not wait another 2 points, and live longer.

The next 2 trades, did not move at all in my favor, and I took full losses on those. At some point, I should probably have stopped trading for the day. The last trade did move in favor, and gave me a smaller loss.

Learnings (in hindsight)?

The major mistake today was SAR'ing a wee bit quickly on Trade 3. Had the Stop Loss remained at +20 points, a lot of points would have been retained. Maybe, I should also think of reducing my Initial Stop Losses, and even locking in small profits. Finally, just like yesterday, I probably got the right entries but do not have the points to show for that. So, need to work on trailing the Stop Losses better.


Monday, August 1, 2016

Got some - Day Trading: August 01, Intraday

Movement, finally

Nifty broke out of the slumber of the past couple of days, and crashed. I could not make the best of of it, but still managed some points.


Nifty M3 Price Action Chart


Missed the start of the move

Nifty gapped up, and Spot went above 8700. Ignored the first pin bar, since it did not break the day's high. Placed short trigger below the green bar that broke the day's high. Had that order on for a long time, but cancelled it when a couple of small bars did not trigger it, thinking of the probability of 8750 being tested, and the trigger was just above the 8700 Nifty Spot Price. I would probably not have cancelled the order, if Nifty Future had touched 8750 before coming down. In hindsight, that was a bad move, and I missed the beginning of today's down move.

Caught the crash just in time - first trade

I drew a support line and waited for a breakout pullback. Ignored the first time it happened. The second time, I was able to get in just before the crash. Just in time, because I had an errand to run immediately after that. Got the 20 points first target easily. The exit was a typo. I had intended to move the Stop Loss to 2 points above the close of the crash bar, but entered it as 2 point above the low of the bar. I do not regret achieving a better exit, and will probably do it again.

Not many points from the directional move

All of today's trades were Breakout Pullbacks. I initially missed the Trade 2 entry because I was not watching. I entered when price came back up to my entry level - and this was against my rule on how to trade momentum. The second trade got me the 20 points. Ignored the Breakout Pullback that followed Trade 2 exit, because 8650 close by. The last trade went close to 20 points, but I made a loss. For that trade, I kept the Stop Loss above Round Number 8650. Round Number protected my Stop Loss on Friday, but the plan did not work today.

This 20 point booking is totally against the motto that I had for the Range Compression Trading System, where I was supposed to trail slowly. A different trailing Stop Loss strategy would have given better results today.

Trades that did not materialize

On the chart, I have marked the all the points where I anticipated a trade - that never materialized - or where I had cancelled the trigger by the time the trade materialized.

The bad misses (in hindsight):
1. Missing the start of the down move
2. Not taking the Breakout Pullback after the Trade 2 exit.
3. Did not get the setup to go long at Breakout Failure of 8650

Patience is (hopefully) a virtue.


First Day of New Series - Day Trading: July 29, Intraday

Posting again

I am trading Nifty Futures discretionary again. I had decided not to post the trades, but then decided to post because a couple of days ended profitably. Let me also admit that I would not have posted these trades if the days had ended in losses. Since these are discretionary trades, it makes sense to record the day's analyses and actions, ostensibly for future reference. If my record on this blog is anything to go by, I will probably post trades until I get hit by the next big drawdown. For now, I have decided not to live tweet my trades.


Nifty Price Action Trades


Dull Day

It was the first day of the August series, and was a dull day. After the first big bar, there were bounces from the previous day's support level. I did not enter there because I thought that I should wait for better setups. The price did move to the target 8700 from there. In this round of trading, I have decided to be patient, and trade less, even if I miss many good trades. I have been retweeting about patience on my Twitter timeline.

Shorted the Pin Bar

At 8700, a pin bar with good volume formed. I placed my entry below that bar. The bar that followed took out the high of the pin bar, but I decided to keep the trigger. I moved my Stop Loss to the pivot high below 8700, but soon the price action scared me into moving the Stop Loss back above 8700 again.

Bulk Deals saved me?

Couple of times the price rushed upwards, and I thought that the trade would end in a (small) loss, but right at the previous day's closing price, the volume spiked and price retreated. Magic!! Here's a zoomed in view on the M1 chart.


Nifty M1 Chart showing the Bulk Deals


Exit

I am planning to stick to the motto of not taking big losses, and not taking small profits. For now, I have defined the profit target to be at least 20 points. There were a few times when the price reached that objective. I would have definitely moved the Stop Loss to +20 points, if price had touched the Low of the Day at 8668.5, but that did not happen. Exited on auto-square-off.

I have been quite detailed on this post. Maybe, it will help me in the future.


Friday, July 15, 2016

Free Money - Premium Skew

Well, nothing is free, but this is a setup with a very low risk of losing money. Nifty Index is currently (July 14 EOD) at 8565. The derivative premiums are ridiculously bullish. 9000 deep in-the-money (ITM) Puts have almost nil Theta (time value).

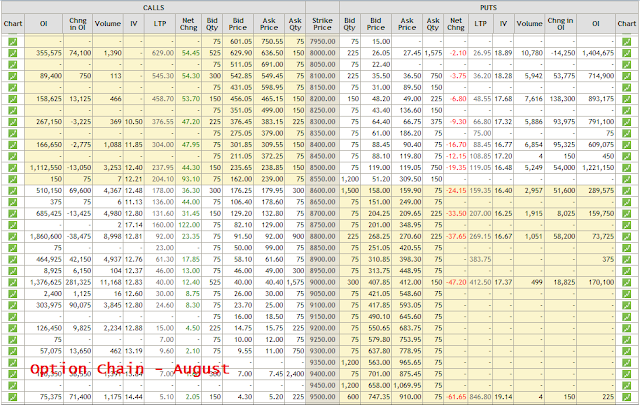
Nifty Option Chain - Strike Price 9000


December 2016 8500 and 9000 strikes are liquid at the moment. It is time to buy the December deep ITM strikes.


Nifty Option Chain - December


Near month at-the-money (ATM) or nearby strikes can be sold again and again. You have time until December to own a free 9000 put. If the price, moves to 9000, the 9000 December Put will still be above 200 - see the current price of 8500 December Put, but the near month puts will lose value. Even if the price moves down, the December deep ITM Puts will have a higher Delta than near month ATM puts. And you can always roll over the near month to the next month.


Nifty Option Chain - July


Nifty Option Chain - August


And given the crazy premiums on the Call side, if you want to play a Calendar Spread, you should buy the near month Calls and sell the far month Calls. Markets are about to open, so posting this in a hurry....


Also read:
Super Stupid Option Premium Skew


Friday, July 1, 2016

Spike & Ledge, could not handle - Day Trading: July 1, Intraday

Today, after the initial spike, I suspected a ledge. It did turn out to be a ledge, only not a good one. I would expect the ledge to finally breakout upwards. That did not happen. The price was in a 30 point range all day.


Nifty M3 Candlestick Chart


Again, I overtraded. The first trade entry was a good one for a spike and ledge. Trailing it was tricky. If I had held on to my initial stop, I could have ended the day with just that one trade. But, I tried to lock in a small profit. Not just that, I reversed the position, when I could have waited for it to go under 8350. What followed is the usual story of getting whipped in the small range.

Click here for the story in live tweets at @BakwaasTrading.


Thursday, June 30, 2016

Too little, too late: Expiry Day - Day Trading: June 30, Intraday

Overtraded. Did not stick to my plan. Got stuck in a bad whip zone on Expiry Day. The move in the later half could not do much.


Nifty M3 Candlestick Chart


The plan was to only take counter trend moves or fake outs, but the fear of missing moves overcame me.

Trading Expiry Days is always tricky. Market can go to sleep, or jump up with a start - as in today's chart.

Day began with a gap up - which is strange for an expiry day. That got me on the edge, and I took entries in both directions hoping for a directional move. Took 6 losses while the market was dull. By the time the move came, I had been cut me up badly. I could have maybe booked better in the dip bar in the last trade...

Rest of the story at my live tweets... click image below to go to the twitter thread

Live Tweets @BakwaasTrading


Thursday, June 16, 2016

Sailing against the wind - Day Trading: June 15, Intraday

Wednesday was potentially good day turned into a bad day, quite deliberately at that.


Nifty Discretionary Trades


Trade 1: Long green bar right at open, and I wanted to go long in the opening second. That did not happen, and the price pulled back slightly below 8150. I thought that I had saved a few points, but when the price came back to 8150, I took the long.

Trade 2: Reversed to short as a Breakout Failure of 8150, looking for a gap closure. Loss. Stop Loss was at 8150.10 instead of 8150. Filled with a slippage of 5 points.

Trade 3: Long on Breakout Failure of range. Could have improved my entry by a few points. This trade moved very slowly and broke 8150. This was followed by a period of volatility in Nifty50 Futures, but calmness in Nifty50 Spot, with Spot staying firmly below 8150. This indicated that Futures would spike whenever Spot broke 8150. Booked at spike.

The Short Bias: The spike was followed by an ascending triangle. Though this is generally bullish, I was looking to short a Breakout Failure of the upper range. The upper range finally broke with a big spike, and there was no Breakout Failure, but I stayed with my short bias.

Day's trades - Live Tweets
Day's Trades - Live Tweets


My first opportunity to discard my bias was then the triangle broke on the lower side. This was a potential long setup, but I decided to hold out for a Breakout Failure of the upper side.

The second opportunity to discard my short bias was the big spike. I had was expecting a regular Breakout Failure, not this huge spike. Besides, there was no Breakout Failure.

The rest of the trades, sailing against the wind: Trade 4 was a short on loss of momentum. Did not work. I shorted right in the spike bar. If I had ignored my bias and been patient, then the next inside bar could have been an opportunity to go long.

Trade 5 was taken as a Breakout Failure of 8200. I was not trading the news. I came to know of the news that caused the breakout only after the Trade 5 entry. These news breakouts can move either way after the spike. Today's news set the trend for the rest of the day.

Trade 4 and 5 could be justified in some manner, but there is very little justification for Trade 6, except something that reinforced my short bias - for no good reason. The Stop Loss for Trade 5 was 8201, but the fill happened near 8199. That made attempt one more short at 8200, but even then I should not have move the trigger above 8200... but the bias.

Trade 7 was a last attempt to go with the trend. Failed.

Markets seem to be in red again. Let's see what today holds. For the moment, I am continuing with discretionary trades.


Wednesday, June 15, 2016

Another loss - Day Trading: June 14, Intraday

I am almost done with this phase of discretionary trading... but not yet. Another loss day. Frustration. But not as bad as Monday. A single win can change the day's mood.

I was looking at one my old trading charts. That is where I want to be, and that is what I attempted to do. Here's how it turned out...


Nifty Price Action Trades


The missed move: It opened in yesterday's range. I was ready to go long as the price approached 8100, but did not take the trade waiting for a better setup.

Live Tweets of Day's Trades

Trade 1: My bias was long, but I took the short trade with the hope that price would fall back into range and then do better. It did, and I was able to exit for a profit, but only because I ignored move in my trading time frame. The move was smoother in higher time frame, but was jerky in my trading time frame. And there was more steam in that move after my exit.

Trade 2: I thought that this was a good breakout failure, but lost. Did not attempt trailing stop. The exit could have been a reversal point, but I ignored.

Trade 3: Hoping for a crash (with momentum), since the trend is down, but it turned into a Breakout Failure of Previous Day's Low.

Trade 4: Attempted an early Breakout Failure of 8100. Failed. Stopped trading for the day.


Monday, June 13, 2016

In the dumps, again - Day Trading: June 13, Intraday

Today was one of the usual days for me, where I lose a lot and wonder what I should do next.

It doesn't appear that this phase of discretionary trading will last long. Maybe, I overtraded. Maybe, I did it all wrong. Maybe, it's just one of those days. I am not even sure.


Nifty Price Action Chart


Gap down: The day opened with a large gap down. Price hung around 8100 Nifty Spot. If not for the 8100 BRN below, I would have shorted below the range.

Trade 1: When even after the gap down, price could not reach 8100 for a long time, I took a long after a range compression in the bottom. Loss.


First Trade Entry - Live Tweet


Trade 2: Breakout Pullback of 8100. Another loss. In both trades 1 and 2, I could have trailed tighter.

Trade 3: Breakout Failure of 8100. This one burned me quickly.

Trade 4: Trend Continuation (or is it Breakout Pullback, I am not sure of the terminologies) entry. Unlucky to have my stop hit. This is the one trade in which I tightened my Stop Loss early, and this is the one trade on which it would have been better not to. Damned if I do, and damned if I don't.

Trade 5: Breakout of Day's High. Maybe, I could have bettered my entry by a couple of points. I was hoping for a gap closure. False hope. Maybe, I should have scalped this one to reduce today's pain, but no - I live on hope.


Sunday, June 12, 2016

The Surprise Side - from the Phantom of the Pits

Here's an excerpt from the PHANTOM OF THE PITS. I know that this is something that I should know about trading, but I never thought about it this way. It's (instinctive) common sense to look both ways before crossing the road, regardless of what the rules say.


The Surprise Side


POP: When the walk light comes on, assume there is traffic that will run the red light at each intersection you cross. What do you do now before you cross the intersection?

ALS: I would double-check and look both ways before crossing.

POP: Of course, that is the correct answer -- you know what I am after. Now, just because you looked both ways before you crossed and each time you cross you looked both ways and each time there wasn't any traffic that ran the stop light, is there any reason to stop looking each time you cross the intersection? Your answer, of course, is no, you won't stop looking.

What kind of limits did I just give you? Are they life-saving limits before you cross the intersection? Yes, they certainly might be, but you will never know that if you follow the restriction each time you cross the intersection. You can't know if it saved your life for you prevented finding out by looking each time.

But what if you don't look and you lost your life. You certainly won't know you should have looked either.

Does the restriction tell you that, if you look, there will never be any traffic running the stop light? No. Does your experience of crossing and looking tell you what the probability of someone running the light will be? You can make an assumption based on your knowledge at this point. What does an assumption do? It actually presents criteria based on proven facts that are a possibility. It in no way gives you a high probability or low probability but the best answer you can present.

I don't want to lose you in this thinking but to point out that it's the same in trading as in crossing an intersection. We need to make our best assumption of what is possible. We must plan for that assumption in trading as long as it is a possibility and not just when it is probable. This is a very important point in understanding Rule Number 1 correctly!

If you were never to look at the intersection until proven wrong for not looking, wouldn't it be too late? It is the same in trading. You must protect yourself from any possibility in trading and not just protect yourself when the probabilities are high.

This will be the surprise side in trading The surprise side is a possible outcome but not a very high or likely probability like today's grain trade. When someone gives you a gift, you are surprised by it. Getting that gift was not a high probability. However, you are prepared for that surprise because you say, "Thank You!"

Most traders plan only for the probability side and that, to them, is always what they consider the winning side. This is the biggest mistake you can make in trading. Instead, you must plan for the losing side.

Reversal day - Day Trading: June 10, Intraday

Friday was a great reversal day. On Thursday, CNBC was telling us about how it was the first significant fall after the rise from 7700s. On Friday morning, there were analysts on the channel revising estimates upwards, and the afternoon there were analysts on the channel revising estimates downwards.


Nifty Price Action Chart


Missed upmove: In the pre-open, Nifty was below 8200, so I was hoping for a long entry around 8200, even before the trading session began, but I was fooled out of the upmove.


Day Trades - Live Tweets


After open the VWAP stayed around 8216 for a long time, and I had no ideas while it was ranging. Then the price started creeping up slowly, and I still had no plan on how to enter.

Trade 1:  I saw a Pin Bar after some time, and took the counter-trend short. Even when price got back to creeping up again, I was hopeful that it would not crack the tail of the Pin Bar. And if it did crack, I could still look for longs above 8250. But crack it did, and how!!

After the spike: As it got close to 8300, it was obvious to start looking for shorts, but I decided not to trust my quick fingers. Then there was that period within the spike bar, where I could have gone either long or short.

Trade 2: Finally, I decided that the price had cooled down and went counter-trend short. After some hesitation, there was that crash. Moved my stop to just above 8200, hoping for a further crash, but the stop hit.

Trades 3 & 4: Made a couple more attempts to go short with the bias at pivots. Both were losses, but Trade 3 has an MFE of +14 points, but I still made a loss on it.


Failed to book profit at extreme - Day Trading: June 9, Intraday

The day open looked like a continuation of Wednesday's range, but then it broke lower without a hint. Or if there was a hint, I never got it.


Nifty Price Action Trading


Trade 1: After the fall, there was some volatility - all below 8250 - followed by a range contraction. I went counter-trend long above the contraction, hoping for a reversal of the fall.

Trade 2: Reversed to short when there was a Breakout Failure at 8250, since it was with trend. Exited when price bounced from the near the day's lows.

Trade 3: The bounce did not reach 8250, and my bias was short because of the morning fall. Kept an open short below the pivot, that triggered.

Day Trades - Live Tweet


When the price closed in on 8200, I was ready to lock in at 8206, but then decided to waited for a breach of 8200 to do so. That never happened and the moment was gone. Exited much later for paltry points. It's good to lock profit at lows and highs, but there is always the anticipation that the momentum might further extend the move.... delay and the moment is gone. Book or reverse position, and you might regret (or not).

Trade 4: After the fall, the price started moving up again. I would have gone long, if I saw a good setup. However, once it dipped below 8229, and started moving up again, my mood turned short.

Finally, the reason for going short was a glitch in my chart, but (to my credit?) I did not cancel that trigger.


My new avatar in discretionary trading - Day Trading: June 8, Intraday

Since Wednesday, I have started my next phase of discretionary trading. I do not know how long this phase will last since I am given to system hopping. I hope to update my trades on this blog as well as real-time on twitter. The updates on this blog will be delayed, but I will try to update... until I don't ;)

Nifty Price Action Trades


Trade 1: It was a dull open, and I took the first Breakout Failure of the opening range. The trade failed, but the BOF that followed broke the other extreme of the range went near 8300. The second BOF was also a BOF of Tuesday's swing low, whereas the first BOF had not touched that swing low.


Time to go Short - Live Tweet
 
As the price hovered below 8300, I was planning to short, especially if it touched 8300. Finally, did not take the trade. Price fell and broke the low of the day.

I was not interested in the taking the next Breakout Failure because of the range above.

So, Wednesday ended up as a single trade day.

Wednesday, March 16, 2016

Nothing to be happy about - Day Trading: Mar 16, Intraday

Trade 1: Breakout Failure of Yesterday's Low. Failed.

Trade 2: SAR'ed when Trade 1 Breakout Failure did not succeed. Should have locked some profit on this trade, but it seems that I have not learned any lessons from the past 2 days.

Trade 3: Range Compression Short. Though it was just above 7450, I took it anyways. I have succeeded with these kind of entries earlier this month.

Trade 4: Fed up of my losses over the past few days, I shifted to a 100% mechanical trading system. This time it succeeded. I hate to switch Trading Systems in the middle of the trading day. Usually, I avoid the switch unless the system is giving me a huge drawdown. That wasn't the case with this discretionary trading system though. So, for tomorrow, I am undecided on whether to go mechanical or discretionary.


Nifty M3 Candlestick Chart


Tuesday, March 15, 2016

☹ - Day Trading: Mar 15, Intraday

Obviously, I am clueless. Need to think about changes to my current methodology. And should I go back to Mechanical Trading?

If there is one thing about today that I would want to change, it is the SAR trades at the start. I got off to 3 consecutive losses in minutes.


Nifty M3 Candlestick Chart


Monday, March 14, 2016

Got chopped in the chop - Day Trading: Mar 14, Intraday

Bad day started off well.

The first trade was a short below the consolidation after spike. Was unfortunate that that trade hit Stop Loss. Then, 2 losers followed, and after that I could not recover.


Nifty M3 Candlestick Chart


Friday, March 11, 2016

Did I do it right, or did I do it wrong? - Day Trading: Mar 11, Intraday

The same clueless trading. 9 trades in total. The first 5 were losers, and the next 5 were winners. To my credit, I applied the exact same logic to my entries and stops throughout the day - irrespective of whether I was in the losing or winning phase. So the question is pretty much rhetorical... What I should really be asking is - Is it right to win, and wrong to lose?


Did I do it wrong?

Trade 1: Short on Breakout Failure of 7500. I was hoping that it would touch yesterday's afternoon range low - which it did - but there were not sufficient points to lock in profit at that point. After exiting for a loss, I was hoping that it would come back and cover the range again.

Trades 2, 3 and 4: Trade 2 entry was below the pin bar after a nice wide range bar. I took the trade even though the momentum was clearly up. So, when the Stop Loss hit, I reversed to Trade 3 long. It broke the Day High with volume, but then started falling. Seeing the fall, I wanted to reverse early, and tightened my Stop Loss to reverse to Trade 4 short. That was another loss.

Trade 5: A breakdown after couple of attempts to break the day high. I was not very confident about the location of this entry, and so I tightened the Stop Loss. Result: It ate my Stop Loss, and then continued its fall. Bad luck?


Did I do it right (but maybe not very right because the exits were wrong)?

Trade 6: Reentered the short. Took this trade even after 5 consecutive losses, because I thought that the previous exit was bad luck.... and if I could take 5 losses, couldn't I take 6? ☚ Reason why I keep losing so often. About the exit, I was conflicted. On one hand, I wanted to book when momentum stalled. On the other hand, I did not want to miss out on a big fall just because I tightened the Stop Loss, like I often do. I finally voted for a wide trailing Stop Loss.

Trade 7: Pullback long. It moved, and I tightened Stop Loss to lock in some points, and it got hit.

Trade 8: Price was swinging for a few bars before it broke out. Then, it immediately fell, and I took that entry. for this trade also, booking on loss of momentum would have been a good idea, but I trailed the Stop Loss to a random point.

Trade 9: Price was going up, and I was cursing myself for not reversing Trade 8 at loss of momentum (though I had only thought of exiting on loss of momentum in Trade 8, and not of reversing the position). Anyways, when the upward momentum stalled, I shorted. There were a few points in this trade also, but I did not get much.


Nifty M3 Candlestick Chart


Thursday, March 10, 2016

Trading by Statistics

Especially while trading discretionary, I am pretty clueless about what I should be doing. What are the patterns on that chart? Are they telling me to go long or short, or am I just fooling myself that they are telling me anything at all? Since I am trading discretionary, it is my discretion to decide when to do what. Isn't it? Or if I already knew what is to be done, then where is the discretion?

(While trading mechanically, at least I have pre-decided rules and hence know what exactly is to be done in each scenario, though the rules themselves may be pretty clueless.)

Now, given that I am clueless about how to use my discretion, and half believe that the markets are somewhat random, how can I still trade? My (current) genius tells me to trade by Statistics. The core idea remains what is described in this post about System Hopping. I need to be profitable, have small drawdowns, and a high rate of capital growth. (Peace of mind is not statistically measurable though, I think)

Add to that the guidelines/core values/motto of whatever system.... and I know that I have to take trades with small Stop Losses, and the high Win Rate. How many losses I log before I net a big win counts more than where I enter trades. It's all about the Payoff Ratio and the System Drawdown. I need to keep my wins much bigger than my losses and reduce the frequency of losses. Let the graphs and probabilities on the Statistics page tell me what to do, rather than the Price chart. Let the numbers scare me into booking a profit, or calm me into relaxing my Stop Loss. The objective is to get the Statistics to look better.... and increase the probability of ending the day positive.


Trading by Statistics


Clueless trading - Day Trading: Mar 10, Intraday

Trade 1: Breakout Pullback of Yesterday's Close.... Hahaha. When it went down to 7450.10, but did not touch 7450, it confused me. I could not decided whether to book, or keep a wide Stop Loss... so finally I compromised and trailed the Stop Loss to somewhere in the middle.

Trade 2 & 3: Range Compression after Failure to Continue to 7450. I could have avoided both these trades if I had kept a wider Stop for Trade 1.

Trade 4: Breakout Pullback of 7450.

Trade 5: Breakout Failure of 7450. When it breached 7500, it was a good opportunity to reverse, but I kept the Trailing Stop Loss wide. Reason 1: I already had too many losses in the previous trades. Reason 2: I thought the Momentum would continue after a Pullback.


Nifty M3 Candlestick Chart