Sunday, August 5, 2018

Kelly Criterion - Money Management on Steroids

This is an analysis of the Optimal Risk for my y48 system trades, calculated as per the Kelly Criterion.

I have been trading the y48 Trading System since May 28th. The details and statistics of the y48 trades are available on my Trading Stats page.

The chart below shows the continuously calculated values of Optimal Risk based on actual trades. There are 3 lines:
  1. The Green Line shows how the Optimal Risk varied for Long Trades.
  2. The Red Line shows how the Optimal Risk varied for Short Trades.
  3. The White Line shows how the Optimal Risk varied for All Trades - both Long and Short.
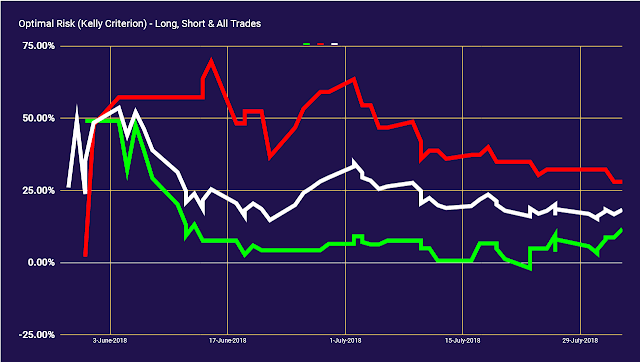
Optimal Risk as per Kelly Criterion

 
The Optimal Risk as per Kelly Criterion is calculated based on 2 parameters - the Win Rate, and the Payoff Ratio. The Optimal Risk is percentage of capital to be risked to maximize capital gain. I had posted earlier about the Kelly Criterion.

The continuously calculated value of the Optimal Risk has varied drastically since May 28, as seen in the chart.


Maximum
Value
Minimum
Value
Last
Value
Long
Trades
49.07%
May 31
-1.92%
Jul 23
11.69%
Aug 03
Short
Trades
69.65%
Jun 15
2.10%
May 31
28.00%
Aug 03
All
Trades
53.61%
Jun 04
14.76%
Jun 22
18.35%
Aug 03


So, as of today, if I expect the performance of the y48 trading system to remain the same as since May 28, I should optimally be risking 18.35% of my capital in each trade. Ideally, if I had risked this Optimal Fraction for all my 64 trades from May 28 to Aug 03, with a 50% Win Rate and Payoff Ratio of 1.58, my Return on Capital would have been 426%.

Even better, if I had risked 11.69% of my capital on each long trade, and 28% of my capital in each short trade. So, if I had risked accordingly on the 37 long trades and 27 short trades done between May 28 and Aug 03, and assuming that the win rate and payoff ratio would have remained the same for the longs and shorts, my Return on Capital would have been 504%.

y48 is just an average trading system - profitable, but nowhere close to some of the better trading systems. However, when boosted by the steroid of Kelly Criterion, even an average trading system can give superlative returns. Are you ready to ride the highs (and the lows)?

Well, my returns with the y48 system have not been as good.... but though considerably lower, they have been very very good. That is because, I obviously did not risk this exact calculated percentage of my capital (obvious, since it is a hindsight calculation). Also, I did not actually compound my capital, since I use a slightly mellower version of Money Management. And, there is small matter that I have not considered brokerage and other costs for these calculations. Those costs would have brought down the value of Optimal Risk by a couple of percentages.

I actually risked between 15% to 35% of my ledger balance in each trade. My ledger balance is just one part of what I define as my trading capital. Currently, I work out my the balance to be held in my ledger based on a convoluted formula that also considers my total liquid funds. That really takes the edge off the Steroid - it mellows of the effect of Kelly Criterion to a tolerable level. But more on that later.....

Wednesday, April 25, 2018

Another losing day

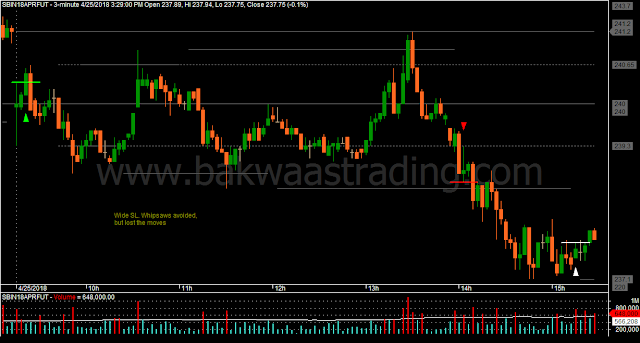
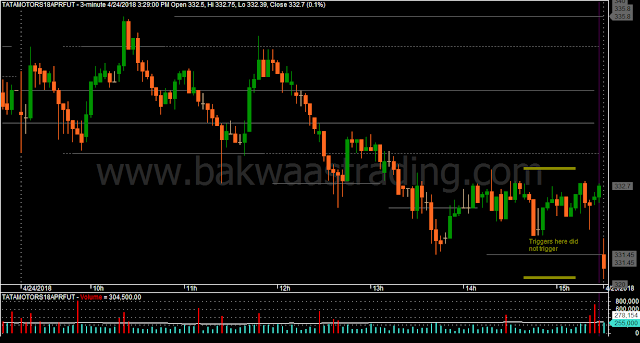
Today was another losing day. I don't mind such losing day's, as long as I am able to avoid disasters like on Monday. While I avoided whipsaws with the wide Stop Losses, I also missed the risky twist and turns that I could have caught otherwise.

Safety first. Avoid whipsaws. Be the hunted.


Day Trading Price Action Chart


Unlucky when I get a fill, unlucky when I don't get a fill

This is a delayed report on yesterday's trade.

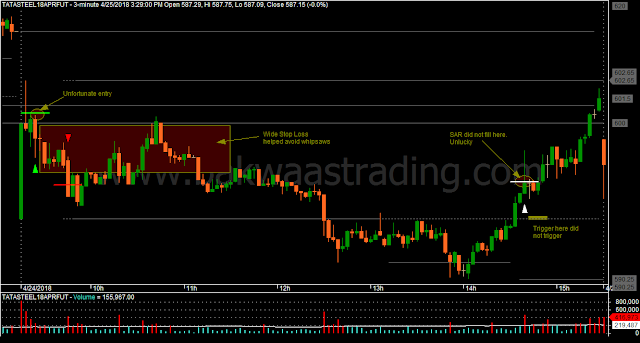
Went with wide mechanical Stop Losses, and that help in avoiding potentially dangerous whipsaws. But it was an unlucky day. For the first trade, I got entry at the highest tick and then the price kept going down. The exit of the second trade was to be a Stop and Reverse to Long, but I got the fill only for the exit, and not for the reversal order. And then the price went up.

So 2 times unlucky...


Day Trading Price Action Chart


Day Trading Price Action Chart


Monday, April 23, 2018

Disastrous Trading

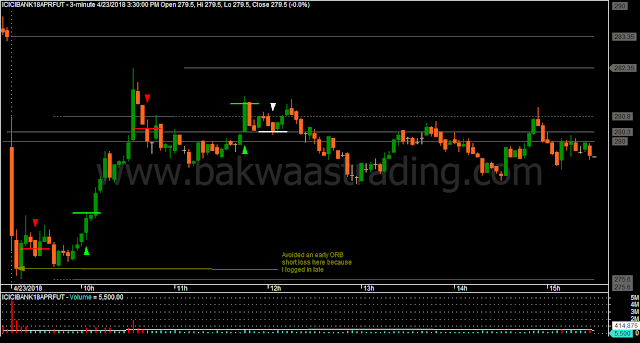
Today was a disastrous trading day.

Thinking of doing the following now:
  1. Make this trading style Mechanical to extent possible, though this is still WIP.
  2. Wait more patiently for entries.
  3. Don't think about reducing the Initial Stop Loss.
  4. Stop trading if the Mark-to-Market is positive when a trade closes.

Day Trading Price Action ICICIBANK


Day Trading Price Action TATASTEEL


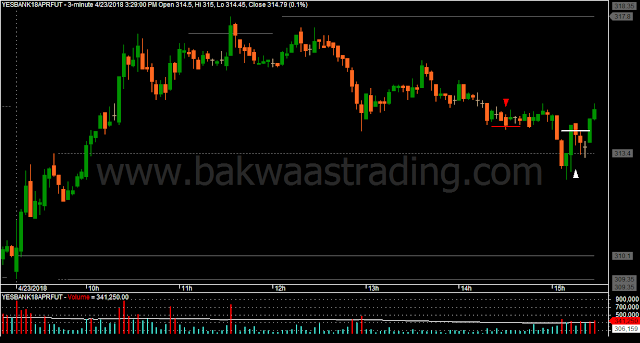
Day Trading Price Action YESBANK


Friday, April 20, 2018

Got shaken out of the Opening Range Breakout trade

Today, I logged in early again in an attempt to replicate my success with Opening Range Breakout yesterday. I found the opening move in State Bank Of India to be impressive, and went short with it. But my Initial Stop Loss was tight and got hit. I had wanted to keep a Stop-and-Reverse to long at that point, but did not have sufficient margin. Such potential early morning whipsaws are the reason why I was logging in late prior to yesterday.

Anyway, if I had stayed on with State Bank Of India, I would have ridden the second breakdown successfully, but that was not to be.

I was already into Hindalco. My 2 trades in Hindalco did not give me much.

After that, I was back to State Bank Of India. I thought that my late short in State Bank would help me get into profits, but that was not to be. Actually, I was in profit in that trade, but the wide Trailing Stop Loss required by the One Good Trade rule, prevented locking any profits in it.


Day Trading Price Action SBIN


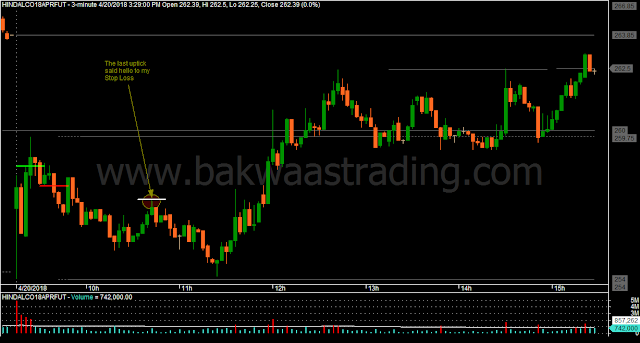
Day Trading Price Action HINDALCO


Thursday, April 19, 2018

Opening Range Breakout: One Great Trade covered yesterday's losses

Finally, I got a One Good Trade. Today, I have more than recovered from yesterday's losses.

Trading the right scrip matters

Today was a metals day (I didn't check the other commodity charts). All of them, Hindalco, Vedanta, Jindal Steel, Tata Steel - all of them were on fire. Taking a Opening Range Breakout Long trade on any one of them would have made me rich.

That way, I was lucky that I chose to go with Hindalco today, instead of State Bank Of India or ICICI Bank. Also, kind of made my own luck, when I decided to switch from Nifty Futures to Stock Futures. Just look at the Nifty Futures chart today. There was no life in it.

On these Stock Futures, though the Day Trading Margin Requirements are higher, the brokerage and other costs are lower per unit of volatility, when compared to the Nifty Futures. An important thing to keep in mind is the volume/liquidity of individual Stock Futures. I am satisfied with the liquidity in the scrips that I have chosen to trade so far, though many times I could not get my entry orders filled for what could have been potentially good trades.

This trading style has been working so far. I guess that it will keep working.... until it stops working. The sun is shining right now... so make hay with this trading system.

Opening Range Breakout

Lately, I have been logging into my trading terminal a good 15-20 minutes after start of trading. It could be that I am just lazy, but I try to rationalize that due to the delay I avoid a number of early whipsaws. Today, I logged in early, just about 3 minutes after trading began.

Though I liked the look of both ICICI Bank and Tata Steel, I decided that I like the pattern on the Hindalco chart better. Hindalco had a good gap up and had higher volumes. That matches the kind of better Opening Range Breakout scenarios that I was evaluating earlier.

This one was a good Opening Range Breakout day, with no deep pullbacks that could take out my Trailing Stop Losses, and I only had to sit through it. The One Good Trade rule for my Trailing Stop Loss kept it wide enough.

From tomorrow, I will try to log in early into my trading terminal to catch similar trades, if possible. Especially, need to keep an eye on the gap ups and volumes at day open.


Day Trading Price Action Chart


Wednesday, April 18, 2018

More lessons about Initial Stop Losses

I started experimenting with small Initial Stop Losses yesterday. Today, I continued the experiment. The experiment has given me very bad results on both days. Is the market trying to tell me something?

Though the impact of today's misfortune with the small Initial Stop Loss in HINDALCO was much greater, I don't feel as bad about it as the small Initial Stop Loss exit in ICICIBANK yesterday. Something quirky - I don't know why. If I had been able to stick with that HINDALCO long, it would have been perhaps my best trading day this month. But I have still not decided whether to end this experiment with the Initial Stop Loss positioning. The perpetual dilemma about Stop Loss positioning continues....

2 losses in HINDALCO, followed by 3 losses in SBIN. Finally, one good trade in ICICIBANK, but overall a very bad day trading day.

That's trading. You win some, you lose some. You pick yourself up and then move on.... Right!!?


Day Trading Price Action HINDALCO


Day Trading Price Action SBIN


Day Trading Price Action ICICIBANK


Tuesday, April 17, 2018

Need to focus on the Initial Stop Loss

Got back to trading after a break on Monday. Was a decent day today.

Traded two scrips - SBIN and TATAMOTORS - and managed to be in-the-money on both.

Started the day with 2 trades in Tata Motors. Scratched both those trades, though there was some profit in both. After that, I thought that Tata Motors might range, and decided to wait for either a Break Out or Break Out Failure at Range Extremes. However, in the meantime, I entered short in State Bank Of India, and so missed the fall in Tata Motors.

While Tata Motors fell, I was locked in my Short position in State Bank Of India, which did not move for quite sometime. But finally, it did fall, and I locked in some profit and reversed to long. I am experimenting with keeping the Initial Stop Loss small - sometimes smaller than what the One Good Trade rule would demand. More whipsaws are expected with smaller Stop Losses, and that is what happened to my long trade in State Bank Of India.

The final trade was a Long in Tata Motors above a congestion. That did not move much.

The whole of last week, I had been focusing on Trailing Stop Losses, and the result was the One Good Trade rule. While that rule has not yet caught any super duper trade for me, it has reduced the number of whipsaws and improved my performance.

Now, I am thinking about ways to reduce the Initial Stop Loss. If a wide Initial Stop Loss is hit, it takes away a considerable part of my profits every time, and I don't like that. Now what should I do about it?


Day Trading Price Action TATAMOTORS


Day Trading Price Action SBIN


Friday, April 13, 2018

The long wait for the One Good Trade

Since I added the One Good Trade rule to my trading, it has been all about waiting for that One Good Trade, which may not even materialize. Yesterday and today, the day started off with losses, and the rest of the day was spent in waiting for the One Good Trade that did not materialize.

It is still early days to judge the rule, but so far, it has behaved reasonably. A very big factor in the results has been luck/fate/kismet - from choosing the scrip that would move on that day (SBIN was good pick today), to being able to get a fill on the order.

Today was another single scrip day for me. It started of with the bad whipsaw of 2 losses. The SAR that caused the whipsaw was particularly jarring, because the tick on which the reversal took place did not even show up on the chart. That's unfortunate, but sort of balances off against my fortune yesterday when the second trade survived by just one tick. See what I mean by luck/fate/kismet?

Even then, there was particular SAR point that I was eyeing after 12:30 PM, that could have turned this into a big profit day. But I was waiting for a retest of the immediate preceding Pivot High. That did not happen.

I will not be trading on Monday. I should be back on Tuesday or Wednesday next week.


Day Trading Price Action SBIN


Thursday, April 12, 2018

Minor Loss in Today's Trading

As the day started, I was undecided on where to take a trade. I had to choose between SBIN, ICICIBANK, VEDL and TATASTEEL.

First, I attempted a short in SBIN on break of the Opening Range Low. When that did not happen, I shifted focus to ICICIBANK. In hindsight, the right choice would have been VEDL, which kept falling through the day.

If instead to SBIN, I had started off with ICICI, I would have gone long on the break of the Opening Range High, and avoided the losing Short trade. Also, I think that the Stop Loss on that fist Short trade was a wide, but I had to keep it there at the Day's High due of the "One Good Trade" rule. Ended with a loss, though there were opportunities to lock in a profit in subsequent trades.


Day Trading Price Action ICICIBANK


Day Trading Price Action SBIN


Wednesday, April 11, 2018

One Good Trade: And Luck... Good Trading Day

One Good Trade

A new addition to my trading rules. I am calling the new rule as the "One Good Trade" rule.

It is basically inspired by my experience in trading Opening Range Breakouts, where my aim was to try to catch the big move of the day from Day Open. That meant either no Trailing Stop Losses, or very wide Trailing Stop Losses. However, there are differences.

The obvious difference is that the trades are not restricted to only Opening Range Breakouts. The entries are based on a variation of the Range Compression Trading System that I traded in Q1 2016. Plus, when compared to my trailing with the Opening Range Breakout Systems, here I do trail quite early before I relax the trailing, just to not appear stupid.

So, in a way, the currently evolving trading method is a mishmash of a lot of my trading experiences. I am still getting the hang of trading Stock Futures, after having focused for long only on Nifty Futures. The current five digit price of Nifty Futures is significantly high compared to what it was a few years back, while the daily range of Nifty has remained almost the same. So, for capturing the same price movement in Nifty Futures, the cost in points has gone up, making it a big disincentive for day trading. I think that one factor affecting Nifty's movements is the fact that the gap between Option Strike Prices has remained at 50 points. Maybe sometimes later, I will have a look at trading Nifty Options, but for now I think Stock Futures may just work out.

Today's trades

Today, indiscipline saved me. I opened my terminal well after 9:30 AM, and liked the look of DLF, TATAMOTORS and TATASTEEL.

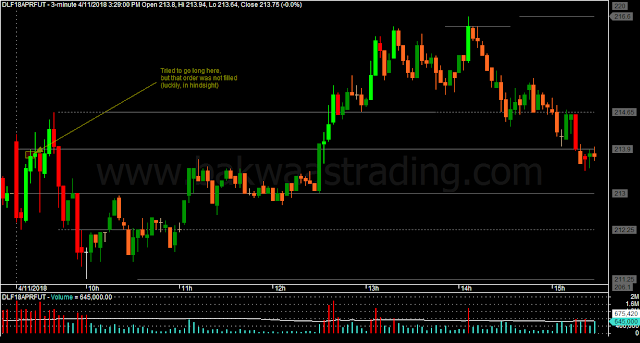
My first attempt was to go long on DLF. Luckily, that order was not filled. Then, I realized that I had missed a short in TATAMOTORS. So, I placed a Limit Short order on TATAMOTORS. Luckily, that did not trigger. With the new One Good Trade rule, that short would not have made a profit, and would have also caused me to miss the long trade. When I saw that the DLF long would have failed, I wanted to go short on DLF, but my money was already blocked in the pending TATAMOTORS order. Lucky again!!

The first long on TATAMOTORS took a long time to move, but I held tight based on the One Good Trade rule. It turned out to be a good day, with all my trades being in TATAMOTORS, and no losing trades.


Day Trading Price Action TATAMOTORS


Day Trading Price Action DLF


Tuesday, April 10, 2018

Bad trading day

Started of the day well, but getting a bit aggressive with TATASTEEL cost me a very good day. If I had learnt the lesson about not trailing aggressively during periods of high momentum/volume/volatility, I would have been a happier person.


Day Trading Price Action ICICIBANK


Day Trading Price Action TATAMOTORS


Day Trading Price Action TATASTEEL


Monday, April 9, 2018

Rolodex Trading

I am not used to trading Stock Futures. Over the years, I have been focused on on trading NIFTY Futures and Options. Rarely, do I trade Stocks or Commodities.

Today, I did not even once check the Nifty Chart. I had my watchlist of Stock Futures. I wanted to focus only on one scrip at a time. So, it turned out to be a kind of rolodex, where I traded each Stock Future in turn.

JUBLFOOD (Jubilant Foodworks)


Was in a bit of a hurry to get on with today's trades. Bad decision (in hindsight). After a whipsaw, managed to pull in some profit with my 4th trade. Then, I thought that Jindal Steel was interesting and shifted focus.


Day Trading Price Action JUBLFOOD


TATASTEEL (Tata Steel)


There was a mismatch between the price in my data feed and the price on my trading terminal. In the confusion, I had to let go a short that was probably a good opportunity. I did not chase that short and shifted back to Jubilant Foods.


Day Trading Price Action TATASTEEL


JINDALSTEL (Jindal Steel & Power)


There was this news about increased steel production and sales by Jindal Steel. I thought that the news was bullish. But when the stock did not react, I was tempted to go short.


Day Trading Price Action JINDALSTEL


ICICIBANK (ICICI Bank)


Caught a very small part of the breakout.


Day Trading Price Action ICICIBANK


SBIN (State Bank Of India)


This one gave me a grand whipsaw, and I could not recover from it.


Day Trading Price Action SBIN


Friday, April 6, 2018

Moving on to newer scrips

Today, NIFTY opened very tepid, and was inside yesterday's range for most of the day. I got bored and had to look at other scrips, but it was quite late. I was trading the scrips after the day's major move on the scrips had already happened.

NIFTY


My Nifty trades today were a fiasco. Initially, I was watching only NIFTY, but soon got bored of the inaction and traded a couple of Stock Futures. Later, NIFTY broke out from its range. Off course, I missed the breakout because I was not watching. Then, I managed a decent short at 10268 when the momentum stalled.

Since, I was watching other scrips during the day and lacked focus, I shorted with only 1 lot. Then, I placed the Stop Loss order with my full position size, but entered the price incorrectly as 102xx instead of 103xx. The typo had caused me to go long, but I reversed to short immediately. Could not catch the full move since the position was auto squared-off.


Nifty M3 Price Action Chart


BHARTIARTL


Saw the news about Bharti Airtel crash on my twitter feed. So I was looking at the chart after the crash had already happened. Tried to catch the price bounce after the crash. That did not work out, but a reversal to short was decent.


Bharti Airtel M3 Price Action Chart


JUBLFOOD


Jubilant Foods has been making new highs for sometime. I looked at the scrip quite late. After the Airtel trade had closed, I was mainly focusing on LUPIN. I looked at JUBLFOOD, only when LUPIN did not form the pin bar I was hoping for.

I took a with trend pullback long in JUBLFOOD, but could not hold on.


Jubilant Foods M3 Price Action Chart


Thursday, April 5, 2018

Bad day

This was RBI Policy Day, as well as Banknifty expiry day. RBI Policy announcement was at 2:30 PM. So, a dull wait till 2:30 PM was expected, but even after the announcement there was not much life in the market.

I could catch very little of the post RBI Policy announcement upmove. I had already been hit by losses in the first half, and missing the move made this a bad day.

I am not sure if I want to continue trading this system in the current fashion. Next week, I'll try to find some time to evaluate this.


Nifty M3 Price Action Chart


Wednesday, April 4, 2018

Totally goofed up, but the day saved me!!!

If I made a profit today, it's totally because of the market. None of the credit can go to me, because I goofed up big time today.

I did follow all my pre-decided trailing rules today - it were the rules that were not good enough. I have been checking my recent charts. I find that the current rules are ok for periods when the momentum and volatility are normal or low.

But for periods when the momentum/volatility are high, I need a different set of rules for trailing the Stop Loss. In fact, I had already considered the rules to be applied for such periods, only I was yet to incorporate them into my pre-decided Trailing Stop rules.

The rule is simple:
During periods of high momentum/volatility/volume activity, do not trail aggressively. But as soon as the momentum/volatility/volume activity returns to normal from high, trail aggressively.

This rule could have kept me out of the whipsaw, that cost me nearly 60 post-brokerage points. Today, instead of following this rule, I tried to trail aggressively during the momentum/volatility period. Off course, it's not as if this rule is a magic wand. It will have to be proven on days of high volatility. Trailing during periods of high volatility is fraught - as I had cribbed after missing the 3 PM fall on expiry day.

The other thing is that though I was on twitter all through the day, I was not looking at the news until quite late in the crash. I had no idea about China's retaliation to the US tariffs. So, going forward, I will try to be off random tweets during trading hours, and maybe follow CNBC on twitter. That would be good for my trading, and also good for my eyes.


Nifty M3 Price Action Chart


Tuesday, April 3, 2018

Managed it better today :)

I looked again at the rules of the Range Compression Trading System that I had followed in Q1 2016. There were 2 rules:
  1. Say NO to small profits, Say NO to big losses.
  2. Be the Hunted
Rule No. 1 has changed. With the lesson about trailing sooner, I now even take small profits, though I try to stay on for bigger profits.

Rule No. 2 stays pretty much the same. It was not like that on Monday, when I tried to hunt - trailed more aggressively - resulting in overtrading and losses. Today, I tried to remain the hunted instead of trying to be the hunter. The stupidity index of today's trades appears to be much lower than that of Monday's trades. Even trade 5, which I thought would look stupid, does not look too very bad on the chart.


Nifty M3 Price Action Chart


Monday, April 2, 2018

What was I doing?

The thing that always happens with me repeated today. I had many reasons not to trade today. I was not able to focus today at all - I had some guests. And then, I went into some sort of revenge mode. Could have just avoided trading today.

It was another 10 trade day for me. Ideally - like I marked on the chart - there should have been just 4 or 5 trades.

No lessons learnt yet, but I am just thinking that in addition to lesson about trailing sooner, I should try to stay longer in the trade just as long as it does not look too stupid. Some very fine balancing needed here!!!


Nifty M3 Price Action Chart


Thursday, March 29, 2018

Trading Stats Archive: 2016 Q1

I have decided to begin updating my Trading Stats page again. In this post, I am archiving the old data that was available on the Trading Stats page.

This data is of my trades during January to March 2016. During that period, I was almost exclusively trading the Range Compression Method. In that system, I used to wait for a visual discernible compression of price in the M15 and M3 charts. Then, I placed a Stop Loss Market (SL-M) order at either end of the range. Trailing was based on a mechanical formula.

With that system, I had a huge profit in the last 3 weeks of January. With the leverage that I was using, I made over 200% profit in January. After that, the exact same system went into a slump, and due to the same high leverage that I was using, I had lost all my gains by the end of April 2016. Note that with even with high leverage, it took me 3 months to lose the gains that I had made in 3 weeks in January 2016. That is the advantage of taking entries when the range compresses and the risk is small.

In the range compression system, I would trail my Stop Loss, only when I was able to lock in a respectable amount of profit. It meant that in many cases, I would book a loss, even on a trade that had moved decently in my favor. That would appear high on the Stupidity Index. In fact, this is what I was doing when I returned from my trading sabbatical. On Friday, when I did not move my Initial Stop Loss even once in 6 trades, I hopefully learned a good lesson about trailing Stop Losses sooner.


Profits by Individual Trade 


Profits by Individual Trade

Profits by Individual Trade


 Profits in Points and Cumulative Profits


 Profits in Points and Cumulative Profits
 Profits in Points and Cumulative Profits


 Profit versus Duration (Scatter Chart)


Profit versus Duration (Scatter Chart)


All Trades: Profits and Losses


All Trades: Profits and Losses

All Trades: Profits and Losses


Trading Statistics: Summary Report


Trading Statistics: Summary Report

Daily Trading Summary


Daily Trading Summary


Details of Individual Trades


Details of Individual Trades


Click here to go to my Trading Statistics Page


Wednesday, March 28, 2018

It was not to be... ☹

A delay in typing the order caused me to miss the 3 PM expiry day move. That entry would have saved the day for me, but it was not to be... I put in the the reversal order, but maybe it did not reach the exchange or something, and what actually got executed was only the exit from long and not the SAR to short.

That was the story of my trading on the contract expiry day today. I took a total 10 trades. So, was busy all through a grinding day and had nothing to show for it.

I liked the volumes when the day began, and went short soon. That initial drop stalled, and I identified the reversal point, but was scared to take a long because the bar was wide. Then, I reversed for a loss, and then again reversed for a loss, and that set the tone for the first half. I was just trying to grab a big expiry day move where there was none.

The second half was better, though it would have been better if I had got the reversal move after 3 PM.

Too many trades today, so I think I will put overtrading as a sin for today. Still, my performance today was better than on Friday, when I had not moved the Stop Loss. So far, the lesson about trailing stop losses sooner seems to be working. How can I make this better?


Nifty M3 Price Action Chart


Tuesday, March 27, 2018

Another bad day

Another bad day, but not as bad as Friday. I did 6 trades today, just like on Friday. On Friday, I did not move my Initial Stop Loss on any of the trades. Today, I did, and so the day was better for me, even though the price range was worse than on Friday.

I kind of guessed that the market was ranging, and even caught some of the reversals, though I missed some. But, on a ranging day, in addition to entering at reversals, we also need to book at extremes to profit. I did not book at extremes, because there is always the hope that it could move just a bit more and then turn into a decent breakout.

I had 6 trades today, even after taking a one hour break in between, but overtrading is still not on my sin list for today!!


Nifty M3 Price Action Chart


Monday, March 26, 2018

Don't look stupid!!

I did have a motto for today's trades: "Don't look stupid." I didn't want to look stupid like on Friday.
(Note: I that said "Don't look stupid.", not "Don't be stupid." There's a difference between the two.)

  • I can look stupid when I miss a good move even after watching the chart the whole while.
  • I can look stupid when I exit early from a big move.
  • I can look stupid when I watch a profit turn into a loss.
  • I can look stupid when I book a series of losses.
  • I can look stupid when I attempt trades on a grinding day.
  • I can look stupid when I broadcast my losses to the world. 
  • I can look stupid just for day trading. (This I intend to do)

  • I can look smart when I capture a big move.
  • I can look smart when I capture a small move that then did not go on to become a big move.
  • I can look smart when I scratch an entry that does not go anywhere.
  • I can look smart by broadcasting more about successes and hiding most of my losses. (I don't do this, and hopefully my twitter feed vouches for it.)
  • I can look smart by spouting predictions, analysis and philosophy like the TV analysts. 
  • I can look smart when I do some positive psyching of myself or others.

I can look stupid when I make a loss.
I can look smart when I make a big profit.

But I am only really smart when I learn the right lessons. I am only really smart when I have a net profitable trading system. I am only really smart when I apply the right money management to profit from a net profitable trading system. I am only really smart when I realize that all that positive psyching is only going to work if I implement a net profitable trading system and money management. (What's the point of this blog?)

Today's trading

The first trade was not very high on the stupidity scale, because it reversed almost immediately and did not give much of a chance to trail. However, it would still look stupid to enter in the middle of previous day's range after a dull opening.

I would have looked really smart had I captured the reversal at the low of the day, but I have the excuse that I was out on some errand at that time.

The second trade would have looked stupid if the Initial Stop Loss had been hit, after entry at the Day's High. The exit would have looked bad if I had not reentered in the same direction.

The third trade was kind of ok, in hindsight, though it was taken just 10 minutes before auto sqaure-off.


Nifty M3 Price Action Chart


Saturday, March 24, 2018

Lesson: Trail sooner

Sometimes, when you look stupid, it might be because you are!! Yesterday, was one such day for me.

However, if a lesson is learnt, then it a money well lost. But, I have been paying these tuition fees, without learning much....

I took 6 trades, did not trail a single one of those Initial Stop Losses. Looks stupid, and is stupid.

I am not putting overtrading in the list of today's sins, because many of those trades could been closed better.

 
Nifty M3 Price Action Chart


Thursday, March 22, 2018

Trading again.... after a long break!!!

I have been on a long break from trading.... almost 2 months. Some personal issues, etc.

Since the past week, I had been thinking of getting back to trading. I got off by back testing different mechanical trading systems, like I always do. And like I always do, I kept getting inconsistent results in all my tests. Systems that work wonderfully well during a few months, stop working in other months. That discouraged me enough to have decided to stay off until April.

But the markets have been moving well recently. And the itch got to me today. Finally, I decided to try some semi-mechanical stuff. By the time I funded my account and logged in, I had missed the reversal at the top.

2 initial losses made me think that today was the wrong muhurat to have got back to trading. But the day ended in green!!!


Nifty M3 Price Action Chart


Monday, January 15, 2018

Losses prevent profits

Friday's excuse. A couple of initial losses changed what could have been a great day trading day.

Nifty M3 Price Action Chart

The open action was just above/near the previous day high. The volume action was not great, but only the fact that price was above range, and looking like it would come down, tempted me to go short - twice. If the action was in the previous day's range, I would have sat on my hands.

The small Stop Losses on those trades resulted in losses, and prevented me from going short again. Thinking about it, a wider Stop Loss would have resulted in a smaller loss than the total losses in those 2 losing trades.

When later, the price broke down with volume, I was not sure of which way it would turn, but just to avoid being left out of a down move, I placed a short at the low of the day. That trade cleared my losses, but my exit was bad. I was anxious to lock in some profit after the initial losses. Then, placed another short at low of the day to catch further momentum, if any. Another loss, and I was back in red.

The price was popping up, but I was patient and waited for a consolidation. And when the consolidation happened, I was not so patient and took a short instead of a long.

At this point, I had 4 losses in 5 trades, on a very good day trading day. To top it, the last 2 trades were even wrong directionally. So, I switched to mechanical trading and managed to recoup losses. I do not intend to post mechanical trades. I believe that I should have stuck to discretionary trading, and tried to make in work. I plan to trade discretionary again this week, and hopefully my resolve will hold this time...... depends on the results.


Friday, January 12, 2018

Getting the direction right

Here are my thoughts on the last 2 days of trading.

Markets are in a sort of range?, but also grinding upwards?.

Wednesday:


Nifty M3 Price Action Chart (Wednesday)


Initially, the price traded within previous day's range. The price had been rangebound in the previous days. So, held back.

The first DP was the low of the day. I did not want to miss a potential sudden drop. So, went short. But then, it began to look like a Breakout Failure, and I immediately reversed. This second trade was the only trade that I got directionally wrong in the last 2 days. If I had kept the Initial Stop Loss of the 1st trade intact, I would have caught the fall.

The next trade was the Breakout Failure of 10600. Booked when momentum appeared later. Then went short when the momentum stalled.

Thursday: 


Nifty M3 Price Action Chart (Thursday)


Again, the price was dull at open, with a small range within previous day's range. Then, a Master Candle happened that covered the Day's High and the Previous Day's Close. I placed triggers at both ends of that Master Candle. When the long triggered, I tightened the Stop Loss. In hindsight, that was a mistake. Also, in hindsight, an aggressive entry with smaller Stop Loss within the Master Candle's range would have worked. The lower risk on the tight Stop Loss would perhaps have kept me from tightening the Stop Loss prematurely.

The next long worked. I was able to book at the momentum candle, even though my data feed painted the candle after some delay. Then, the long tails inspired me to go short. The Stop Loss just 1 point higher would not have been hit. Later, I went short again. This time it worked, but not before a scare that almost took my Stop Loss.

The fall was good and took out 10650. I reversed to long when the momentum stalled.

Observation:

So, I only got one trade directionally wrong in the last 2 days, but still did not earn much. Now, would it have been wiser to keep the Stop Losses wider and avoid SL hits in many trades. But then, what would have happened if the direction was wrong. After all, at the point of entry, I never know if the trade is going to work out. The perpetual dilemma continues....