Showing posts with label Trading System. Show all posts

Sunday, August 5, 2018

Kelly Criterion - Money Management on Steroids

0
This is an analysis of the Optimal Risk for my y48 system trades, calculated as per the Kelly Criterion.

I have been trading the y48 Trading System since May 28th. The details and statistics of the y48 trades are available on my Trading Stats page.

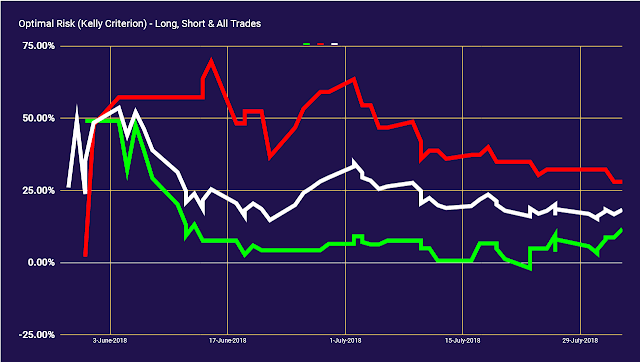
The chart below shows the continuously calculated values of Optimal Risk based on actual trades. There are 3 lines:
  1. The Green Line shows how the Optimal Risk varied for Long Trades.
  2. The Red Line shows how the Optimal Risk varied for Short Trades.
  3. The White Line shows how the Optimal Risk varied for All Trades - both Long and Short.
Optimal Risk as per Kelly Criterion

 
The Optimal Risk as per Kelly Criterion is calculated based on 2 parameters - the Win Rate, and the Payoff Ratio. The Optimal Risk is percentage of capital to be risked to maximize capital gain. I had posted earlier about the Kelly Criterion.

The continuously calculated value of the Optimal Risk has varied drastically since May 28, as seen in the chart.


Maximum
Value
Minimum
Value
Last
Value
Long
Trades
49.07%
May 31
-1.92%
Jul 23
11.69%
Aug 03
Short
Trades
69.65%
Jun 15
2.10%
May 31
28.00%
Aug 03
All
Trades
53.61%
Jun 04
14.76%
Jun 22
18.35%
Aug 03


So, as of today, if I expect the performance of the y48 trading system to remain the same as since May 28, I should optimally be risking 18.35% of my capital in each trade. Ideally, if I had risked this Optimal Fraction for all my 64 trades from May 28 to Aug 03, with a 50% Win Rate and Payoff Ratio of 1.58, my Return on Capital would have been 426%.

Even better, if I had risked 11.69% of my capital on each long trade, and 28% of my capital in each short trade. So, if I had risked accordingly on the 37 long trades and 27 short trades done between May 28 and Aug 03, and assuming that the win rate and payoff ratio would have remained the same for the longs and shorts, my Return on Capital would have been 504%.

y48 is just an average trading system - profitable, but nowhere close to some of the better trading systems. However, when boosted by the steroid of Kelly Criterion, even an average trading system can give superlative returns. Are you ready to ride the highs (and the lows)?

Well, my returns with the y48 system have not been as good.... but though considerably lower, they have been very very good. That is because, I obviously did not risk this exact calculated percentage of my capital (obvious, since it is a hindsight calculation). Also, I did not actually compound my capital, since I use a slightly mellower version of Money Management. And, there is small matter that I have not considered brokerage and other costs for these calculations. Those costs would have brought down the value of Optimal Risk by a couple of percentages.

I actually risked between 15% to 35% of my ledger balance in each trade. My ledger balance is just one part of what I define as my trading capital. Currently, I work out my the balance to be held in my ledger based on a convoluted formula that also considers my total liquid funds. That really takes the edge off the Steroid - it mellows of the effect of Kelly Criterion to a tolerable level. But more on that later.....




Read Full Post »

Thursday, March 29, 2018

Trading Stats Archive: 2016 Q1

0
I have decided to begin updating my Trading Stats page again. In this post, I am archiving the old data that was available on the Trading Stats page.

This data is of my trades during January to March 2016. During that period, I was almost exclusively trading the Range Compression Method. In that system, I used to wait for a visual discernible compression of price in the M15 and M3 charts. Then, I placed a Stop Loss Market (SL-M) order at either end of the range. Trailing was based on a mechanical formula.

With that system, I had a huge profit in the last 3 weeks of January. With the leverage that I was using, I made over 200% profit in January. After that, the exact same system went into a slump, and due to the same high leverage that I was using, I had lost all my gains by the end of April 2016. Note that with even with high leverage, it took me 3 months to lose the gains that I had made in 3 weeks in January 2016. That is the advantage of taking entries when the range compresses and the risk is small.

In the range compression system, I would trail my Stop Loss, only when I was able to lock in a respectable amount of profit. It meant that in many cases, I would book a loss, even on a trade that had moved decently in my favor. That would appear high on the Stupidity Index. In fact, this is what I was doing when I returned from my trading sabbatical. On Friday, when I did not move my Initial Stop Loss even once in 6 trades, I hopefully learned a good lesson about trailing Stop Losses sooner.


Profits by Individual Trade 


Profits by Individual Trade

Profits by Individual Trade


 Profits in Points and Cumulative Profits


 Profits in Points and Cumulative Profits
 Profits in Points and Cumulative Profits


 Profit versus Duration (Scatter Chart)


Profit versus Duration (Scatter Chart)


All Trades: Profits and Losses


All Trades: Profits and Losses

All Trades: Profits and Losses


Trading Statistics: Summary Report


Trading Statistics: Summary Report

Daily Trading Summary


Daily Trading Summary


Details of Individual Trades


Details of Individual Trades


Click here to go to my Trading Statistics Page


Read Full Post »

Sunday, September 10, 2017

Perpetual Dilemmas

0
Since my last post, I have been system hopping again. I have evolved the discretionary range compression trading system into a mechanical trading system. That is one reason that I stopped posting. The other reason is that I have started trading Crude Oil after many years, so my free time has reduced by that much.

By now, the trading system is almost the opposite of the narrow range consolidation system that it evolved from. Now, I am looking for a sustained move in one direction that could potentially build into a bigger move in the same direction. The Stop Loss is wider, but not too wide. The system hopes to catch at least 95% (or 19 out of 20 times) of the big moves early on - but whether it will be able to remain in position to catch the bulk of the move is open to question. And it is still evolving, even during runtime.

So, the perpetual dilemmas continue.... discretionary vs. mechanical trading systems, wide stop losses vs. narrow stop losses, fixed stop losses vs. trailing stop losses, limit entries vs. trigger based entries, price action vs. statistical trading, scalping vs. swing trading... the list of alternatives goes on.

Sometime what works doesn't work at other times, on other scrips or on the same scrip.... as in Friday's trades below. System that worked for me for months, just stop working after some time. This has happened to me multiple times with the Opening Range Breakout system. Even the Range Compression trading system worked very well for sometime. The Princess Trading system that I traded for 11 months- that is longest that I have traded a single trading system - did not work during the first half of 2017, though it has started to perform again recently.

Friday's trades:

Nifty was clogged in a range. Not a good day with my current mechanical trading rules....

NIFTY M3 Price Action Chart


Crude Oil has been a revelation. The plan is to catch the momentum moves. I have decided to watch Crude Oil only after 5 PM, because it is usually boring and misleading until then - but sometimes moves to start right at the day beginning like on September 5th.

The plan was also to close the chart at 8 PM, unless I had an open trade, but Friday's move will make me keep the charts open longer, I guess.

CRUDEOIL M3 Price Action Chart


Read Full Post »

Sunday, April 23, 2017

Princess Trading System Performance till date

0
Unusually, for a system hopper, I have been trading the Princess Trading System since August 30, 2016. I have been evaluating other trading systems off-and-on in the hope of finding something better. A few evaluations have identified systems that are probably good, but I continue to stick with the Princess.

I am ok with the system performance so far, and I am hopefully ready for the perils of this system when it hits me.... that is unless I shift to another trading system before that.

Here is the chart of the ledger performance, trading only Nifty Futures with the Princess Trading System....

Princess Trading System Performance - Ledger View


The Princess system is an intraday system that doesn't trade every day. But when it trades, it trades with maximum leverage. For this trading system, Kelly Criterion allows me to risk 15-20% of my capital in each trade. Consequently, the ledger balance is volatile. I have psyched myself up, and am hopefully prepared to handle even a 90% drawdown, in the hope that the remaining 10% will recover back to the peak in a short time. (Naive??)

The maximum drawdown so far has been 34.84% of the peak ledger balance. As with any highly leveraged trading system, the system trades more lots as it travels drawdowns from peaks to troughs. Recovering from the drawdowns is a slower process, because only fewer lots can be traded with the lesser cash available at troughs.

As this is a volatile system, I periodically take out some money (my dividend), to buffer the psychological impact of drawdowns. But I also add to the capital, when I see the account dipping, so that.... well, I am as stupid as that.

The chart only shows the EOD value of the ledger balance. If we consider the intraday swings in the ledger balance, the system is actually way more volatile than what the chart shows.


Read Full Post »

Wednesday, November 16, 2016

Better Opening Range Breakout - the Overnight Gap setup

5
In my earlier post about Opening Range Breakout, I had mentioned a very simple way to trade the Opening Range Breakout. It was a simple trading system, where upon completion of the ORB period,  entry triggers were placed above and below the Opening Range.

That system had a positive expectancy - both in backtests as well as real trades. I mainly tested and traded that system on Nifty50 futures. The issue with that system was that it was given to huge drawdowns. With optimizations, the win rate ranged between 20% to 30%, with a reward-risk ratio of 4:1 or more.

I have been testing Opening Range Breakout with different parameters, and one of the obvious tasks is to attempt to improve the win rate to minimize drawdowns. This process is still work-in-progress, but let me share one of my findings.

The tests were done on the NIfty50 Future data of the last 4 years. I find that if Opening Range Breakout trades are taken only when there is a significant overnight gap, with a few optimizations, the win rate jumps to between 50% and 55%, though the reward-risk ratio goes down to between 1.6 to 2.0.

Compare the 2 results:

System   My Old ORB System    ORB with overnight gap filter 
Win Rate 20% to 30% 50% to 55%
Reward-Risk Ratio 4.0 to 6.0 1.6 to 2.0


I have given ranges for the Win Rates and Risk-Reward Ratio, but keep in mind that the Win Rates and Risk-Reward Ratios generally have a inverse relationship. So if I optimize the old system for a Win Rate of 20%, then the Risk-Reward Ratio would be closer to 6. Similarly, if I optimize the old system for a Win Rate of 30%, then the Risk-Reward Ratio would be closer to 4.

Which system would you choose? Applying the Kelly Criterion to maximize returns, the choice would generally be to go with the overnight gap filter.

While using the old ORB system, the Kelly Criterion would restrict the capital risked per trade to between 6% to 12%  and have an expected return of 2 to 10 times the initial capital per 100 trades. (The results that I got while trading the system were closer to 2 than 10). With the Overnight Gap filter, due to its higher win rate, the capital risked per trade according to the Kelly Criterion would be 15% or more, giving a minimum expected return of 25 times the initial capital per 100 trades.

But again, let me put the disclaimer. There are no minimums in trading. If you have the bad luck to hit a bad drawdown, or a big slippage, or makes typos, or go psycho... then there are no minimums... psycho gamblers especially have the talent of getting account balances below zero very quickly. Even ignoring all the bad luck and bad psychology, there is no guarantee that the market will continue to behave the way it did in the past to make Opening Range Breakout a successful Trading System. These are estimates based on past data, and not a prediction of the future performance.

Below, is an image on the how the ORB trades with overnight gap filter panned out on the November Nifty50 H1 charts. The Yellow bars indicate the days on which the setup occurred.


Opening Range Breakout with Overnight Gap


I have also found a few setups that can increase the expectancy of Opening Range Breakouts further... but the study is still in progress.


Read Full Post »

Thursday, November 3, 2016

Kissing the frog - Trading System evaluation

0

The Prince of the Markets


Once upon a time, not so long ago, there was a Prince (in reality, a pauper) called Augubhai, who was attracted to every Trading System that caught his eye - as though the Trading System were a Princess. He would embrace the Princess whole-heartedly, close his eyes and kiss her - only to realize that the Princess was a frog, when he opened his eyes.

Disappointed, but not disheartened, he would muster vim, and with renewed vigor, he would resume his search for his ideal Princess. And then he would embrace her whole-heartedly, close his eyes and kiss her - only to realize that it was a frog - like always.

The Prince was smart fellow (in reality, a stupid fellow - but this is a fairy tale). One day, while thinking with the core logical part of his left brain - just as logically as Archimedes did long, long ago - he had an eureka moment. He realized that every time he kissed a Princess, it turned out to be a frog. So, logically, if he kissed a frog, it should turn into a Princess. It was so logical a postulate, that he was surprised that it took such a long time for a smart fellow (in reality, stupid) like him to discover it.


The reality of the Markets


But the Prince finally realized that his postulate was not working. As they say, the reality of the markets is different from the reality of logic and reason and Archimedes. As they also say, it is yucky, and not easy to kiss frogs. Kissing frogs did not turn them into Princesses - at least, not too often. Kissing frogs needs you to discard irrational exuberance that this one will be a Princess. But you also need that little hope - a low probability hope - that there would be a Princess somewhere out there. This hope is not like a exuberance of a lottery buyer, because kissing frogs is much harder than buying the lottery.

The Prince stopped trading every random Trading Systems that seemed visually, logically and/or emotionally pleasing. Trading Systems that appeared to be visually, logically and/or emotionally pleasing seemed to be Princesses, but in reality, most were frogs. The records of the Prince trying out random Trading Systems, day after day, month after month, year after year can be found in the Princess Diaries in the Traderji forum:


Persistence and Perseverance


Now the Prince takes a hard look at Trading Systems before trading them, backtesting and scenario testing them, before actually trading them with money. After all, these Trading Systems are mostly frogs, and frogs rarely turn into Princesses. The spirit of what the Prince does now is similar to what he describes in these pages at Traderji: http://www.traderji.com/trading-diary/90116-dasara-system-49.html#post918162.

The Prince has even frog-zoned the Opening Range Breakout system, at least for now. Even the Range Compression Trading System that he traded earlier this year is out of his embrace. These systems were really beautiful, enticing.... closer to being Princeses than frogs. But Princesses need more refinement and polish, and maybe with some refinement these Trading Systems may turn out to be real Princesses.


Hope... hopefully, not irrational


Fairy tales do not have sad endings... and neither does this one. The Prince actually did kiss a frog that turned out to be a Princess. That is the Trading System that the Prince trades currently. With the application of the Kelly Criterion, the Prince thinks that he will soon amass wealth and riches far beyond his imagination. But the due to past experiences, the Prince has the nagging fear that this Princess would also turn into a frog one day. To mitigate the fear, the Prince continues to evaluate other Trading Systems, continues to kiss frogs in the hope of finding more Princesses to enhance his harem.

One probable reason why the Prince went on the Princess kissing spree earlier, was because he did not have a Princess, and was desperate to find one by any means. Now that he already has a Princess, he is now more choosy and strategic about kissing frogs.... well, at least this is what his psychologist thinks.

Fairy tales have morals. What do you think is the moral of this story?


Read Full Post »

Wednesday, January 20, 2016

The Hunted ▄︻̷̿┻̿═━一 - Day Trading: Jan 20, Intraday

2
Yesterday, I defined the motto of the Range Compression Trading System:


Say NO to small profits, Say NO to big losses.

Today, I will elaborate it a bit further... a supplementary motto:


Be the Hunted

These are on-the-fly rules. I am winging it, until the entire revelation is complete, or until I dump this system (more likely)

In this game we play the hunted. We don't hunt the Price. We stay away from the Price - with a wide Stop Loss. We let the Price hunt our Stops. Price might hit our Stops a few times, but many times it will get exhausted by the effort and slink away. That's when we win.

When we do get hunted, we are not fatally hurt unless we make a big loss. Stick to Motto 1, and you will just have minor wounds.

Today's trades

Gap down, then a bounce (something to do with dead cats). I got my chance to Short there, but Price hunted the Stop Loss down. First Trade, initial Stop Loss hunted. Price had tried to catch my SL a couple of times before it succeeded, and then exhausted by the effort, it fell down.

There was another Short trade that I wanted to take, but luckily did not place. That would have been a loss, if I had placed. Lucky me!!

The second trade - another Short - was the day's winner, but not before Price attempted to hunt down the Initial Stop Loss. The exit was a nice Trailing Stop, I guess, except that I gave up a lot points till it hit. Price went zooming up after the Stop Loss. This win keeps my daily winning streak intact - 8th consecutive win today.

It's just irks that I need to give up a lot of points when the Trailing Stop Loss hits, but I can't complain about the results though, yet. I guess I will have to wait for more revelations...


Nifty M3 Candlestick Chart


Read Full Post »

Saturday, January 16, 2016

Opening Range Breakout - Day Trading like a Swing Trader

2
Opening Range Breakout or ORB Day Trading System is my perennial favorite. It is one of the simplest profitable Day Trading System that I have traded. It is a Day Trading System for the non-Day Trader, the busy executive who doesn't have much screen time, the Taxi Driver who places trades by phone without charts, and the student who doesn't bother about the intraday intrigues of the market.

I know because I was like them - place quick entry orders as soon as possible after Market Open, and scoot to work, and not bother about the market for the rest of the day. The result of the trade could be be checked at the end of the day anyway. And much to my surprise, money would keep coming - day by day, week by week, month by month... until the time disaster struck - like it always does.


Opening Range Breakout - Image Source: pixabay


Augubhai's ORB Trading System


Here are the basic steps of the system:
  1. Define an Opening Range Period - 1 minute, 5 minutes, 30 minutes, or even a Range.
  2. After Market Open, wait for the Opening Range Period to be completed.
  3. Place Stop Loss Entry orders, at the High and Low of the Opening Range
  4. That's about it... except for the exit. You get to set your own exit logic - If I was busy with work, I would try to wait for a few minutes for the entry to trigger on one side, and update the other order to place the Stop Loss at a calculated optimum value from the Entry Price. (For an Opening Range of 1 minute or 5 minutes, the entry usually triggered quickly. Else, canceled the orders, if the Opening Range was wide)


There are a number of methods for trading Opening Range Breakouts, the most famous of them is perhaps Tony Crabel's formula. Many of these methods are for scalping the Breakout or booking profits at targets. My method is more a fire and forget for the day - with a wide calculated Stop Loss, targeting the maximum, but taking whatever the market gives - Day Trading with the attitude of a Swing Trader.

I had given an outline of the system on the Traderji forum, and am pasting that verbatim below:
 
http://www.traderji.com/amibroker/52959-augubhais-orb-system.html#post540835
To answer the queries above - this is a simple intraday ORB system. ORB stands for Opening range break-out.

We decide on a period to watch - it could be the first 5, 10, 15, 30, 60 minutes - anything that you decide. Assuming that we decide that the opening range period is 10 minutes. At the end of 10 minutes, place a Buy Stop Loss order at the day's high(+filter), and a Sell Stop Loss order at the day's low(+filter). The filter need not be a big number, otherwise you could lose some part of a good move.

If the Buy Stop Loss gets triggered, you could either decide to leave the the Sell Stop Loss unchanged or modify it to a fixed percentage or a trailing Stop Loss. It is up to you to decide on the stock, filter, and method of Stop Loss once you are in position.

The premise is that we make the most profits during trending days. Generally, on trending days, the Open and Close are at near the extreme ends of the daily range, with minor pullbacks. So once you are in position, if you set your Stop Loss to avoid pullbacks, then you would get the most of a trending day with less risk. The key here is to decide on the Stop Loss. The Stop Loss will vary from stock to stock and period to period. The AFL will help you backtest and decide on the Stop Loss.

With whatever backtest I have done, the maximum returns were when there was no stop loss. Obviously, that is more risky, and I never trade without a Stop Loss.

This is not something new that I discovered. You will find so many ORB systems on the internet. What I want to share is that I have been profitably trading this system successfully for many years now - on NIFTY and recently on Bank Nifty. (Sometimes there have also been very serious whipsaws as well).

This is an Intraday method that does not require any charts. You just need to know the day's high and low at the end of the opening range period. You also do not need any AFL, except for backtesting.

Hope this answers your queries.


Rationale


The rationale for this system is already mentioned in the snippet above. It is to capture days when the open stays near one extreme (High or Low) of the daily candlestick bar. The number of such days, and the potential points to be made trading this system on such days is huge. Around 60-70% of the time, either the day's high or low is made within the first 60 minutes. If the Opening Range is 5 minutes, then this number reduces to around 20%, but you get to capture more points when you win (Don't take my word for it - Check these out on your charts, and see what's the percentage that you get. This is not very difficult to verify.)

Again, here's my post from Traderji:

http://www.traderji.com/day-trading/89936-opening-range-breakout-orb-intraday-trading-system.html#post867878
OK, here's the thinking behind my method of ORB...

Open the daily chart. How many bars do you see that open at one end and close at the other end? If we capture even some of those bars, could we be in profit?

I traded this mechanically, but if we are smart, we can get better results.


Warning


So, everything is hunky dory so far. But then comes the twist in the tale. You get to win only around 20% of the time. That means that for a random series of 100 trades, there is a 18.5% chance that you could have a continuous losing streak of 20 trades (Check this out with a Streak Calculator). Will you be able to handle this sort of a losing streak? I certainly cannot, at least not at this point - which is the reason that now I don't trade Opening Range Breakout the way it is described above.

Opening Range Breakout or ORB is my first and favorite Day Trading system. My first love. It is with ORB that I had my first Day Trading success - months of big profits, and then I was hooked. Then it all went bad in a few days - poor Money Management being a major reason. There is need to be aware of the risk of huge drawdowns trading the system mechanically as described above. Use it at your own risk.


Trading Systems


I am kicking off this series of posts on Trading System and Methods with my notes on Opening Range Breakout. These are just notes and not a comprehensive review. Maybe, I'll flesh out more details about this Trading System as I continue posting...


Read Full Post »