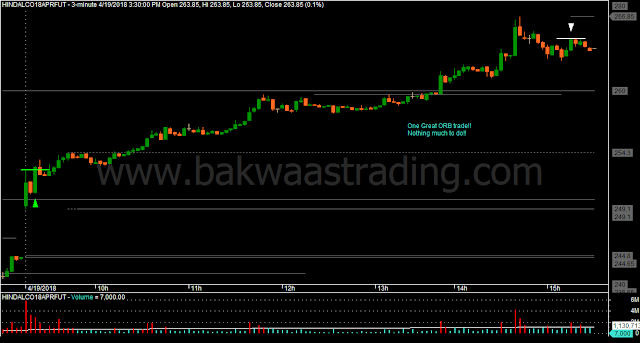
Finally, I got a One Good Trade. Today, I have more than recovered from yesterday's losses.
That way, I was lucky that I chose to go with Hindalco today, instead of State Bank Of India or ICICI Bank. Also, kind of made my own luck, when I decided to switch from Nifty Futures to Stock Futures. Just look at the Nifty Futures chart today. There was no life in it.
On these Stock Futures, though the Day Trading Margin Requirements are higher, the brokerage and other costs are lower per unit of volatility, when compared to the Nifty Futures. An important thing to keep in mind is the volume/liquidity of individual Stock Futures. I am satisfied with the liquidity in the scrips that I have chosen to trade so far, though many times I could not get my entry orders filled for what could have been potentially good trades.
This trading style has been working so far. I guess that it will keep working.... until it stops working. The sun is shining right now... so make hay with this trading system.
Though I liked the look of both ICICI Bank and Tata Steel, I decided that I like the pattern on the Hindalco chart better. Hindalco had a good gap up and had higher volumes. That matches the kind of better Opening Range Breakout scenarios that I was evaluating earlier.
This one was a good Opening Range Breakout day, with no deep pullbacks that could take out my Trailing Stop Losses, and I only had to sit through it. The One Good Trade rule for my Trailing Stop Loss kept it wide enough.
From tomorrow, I will try to log in early into my trading terminal to catch similar trades, if possible. Especially, need to keep an eye on the gap ups and volumes at day open.
Trading the right scrip matters
Today was a metals day (I didn't check the other commodity charts). All of them, Hindalco, Vedanta, Jindal Steel, Tata Steel - all of them were on fire. Taking a Opening Range Breakout Long trade on any one of them would have made me rich.That way, I was lucky that I chose to go with Hindalco today, instead of State Bank Of India or ICICI Bank. Also, kind of made my own luck, when I decided to switch from Nifty Futures to Stock Futures. Just look at the Nifty Futures chart today. There was no life in it.
On these Stock Futures, though the Day Trading Margin Requirements are higher, the brokerage and other costs are lower per unit of volatility, when compared to the Nifty Futures. An important thing to keep in mind is the volume/liquidity of individual Stock Futures. I am satisfied with the liquidity in the scrips that I have chosen to trade so far, though many times I could not get my entry orders filled for what could have been potentially good trades.
This trading style has been working so far. I guess that it will keep working.... until it stops working. The sun is shining right now... so make hay with this trading system.
Opening Range Breakout
Lately, I have been logging into my trading terminal a good 15-20 minutes after start of trading. It could be that I am just lazy, but I try to rationalize that due to the delay I avoid a number of early whipsaws. Today, I logged in early, just about 3 minutes after trading began.Though I liked the look of both ICICI Bank and Tata Steel, I decided that I like the pattern on the Hindalco chart better. Hindalco had a good gap up and had higher volumes. That matches the kind of better Opening Range Breakout scenarios that I was evaluating earlier.
This one was a good Opening Range Breakout day, with no deep pullbacks that could take out my Trailing Stop Losses, and I only had to sit through it. The One Good Trade rule for my Trailing Stop Loss kept it wide enough.
From tomorrow, I will try to log in early into my trading terminal to catch similar trades, if possible. Especially, need to keep an eye on the gap ups and volumes at day open.
 |
| Day Trading Price Action Chart |
>>> My live tweets of today's trades <<<
